<< Chapter < Page Chapter >> Page >
By the end of this section, you will be able to:
  • Describe the various types of body plans that occur in animals
  • Describe limits on animal size and shape
  • Relate bioenergetics to body size, levels of activity, and the environment

Animals vary in form and function. From a sponge to a worm to a goat, an organism has a distinct body plan that limits its size and shape. Animals’ bodies are also designed to interact with their environments, whether in the deep sea, a rainforest canopy, or the desert. Therefore, a large amount of information about the structure of an organism's body (anatomy) and the function of its cells, tissues and organs (physiology) can be learned by studying that organism's environment.

Body plans

Illustration A shows an asymmetrical sponge with a tube-like body and a growth off to one side. Illustration B shows a sea anemone with a tube-like, radial symmetrical body. Tentacles grow from the top of the tube. Three vertical planes arranged 120 degrees apart dissect the body. The half of the body on one side of each plane is a mirror image of the body on the other side. Illustration C shows a goat with a bilaterally symmetrical body. A plane runs from front to back through the middle of the goat, dissecting the body into left and right halves, which are mirror images of each other. The top part of the goat is defined as dorsal, and the bottom part is defined as ventral. The front of the goat is defined as anterior, and the back is defined as posterior.
Animals exhibit different types of body symmetry. The sponge is asymmetrical, the sea anemone has radial symmetry, and the goat has bilateral symmetry.

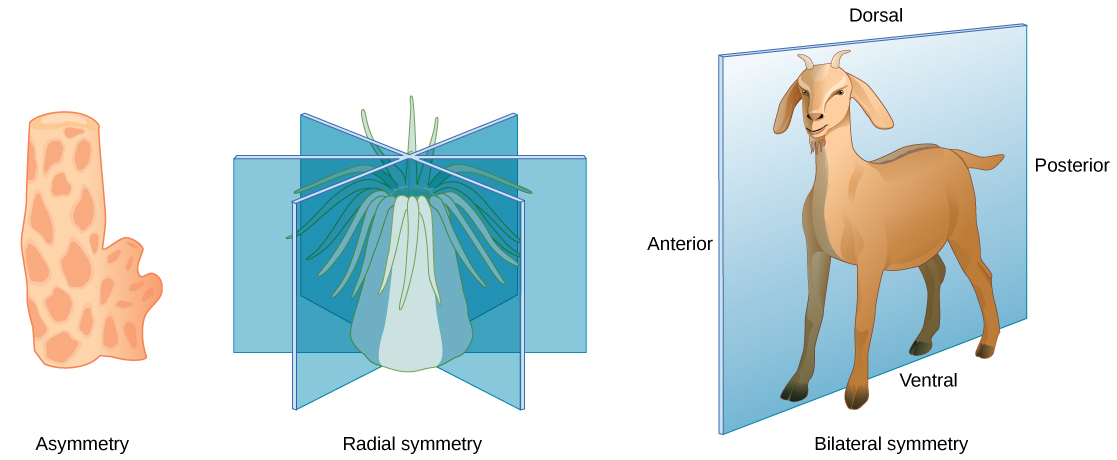
Animal body plans follow set patterns related to symmetry. They are asymmetrical, radial, or bilateral in form as illustrated in [link] . Asymmetrical animals are animals with no pattern or symmetry; an example of an asymmetrical animal is a sponge. Radial symmetry, as illustrated in [link] , describes when an animal has an up-and-down orientation: any plane cut along its longitudinal axis through the organism produces equal halves, but not a definite right or left side. This plan is found mostly in aquatic animals, especially organisms that attach themselves to a base, like a rock or a boat, and extract their food from the surrounding water as it flows around the organism. Bilateral symmetry is illustrated in the same figure by a goat. The goat also has an upper and lower component to it, but a plane cut from front to back separates the animal into definite right and left sides. Additional terms used when describing positions in the body are anterior (front), posterior (rear), dorsal (toward the back), and ventral (toward the stomach). Bilateral symmetry is found in both land-based and aquatic animals; it enables a high level of mobility.

Limits on animal size and shape

Animals with bilateral symmetry that live in water tend to have a fusiform    shape: this is a tubular shaped body that is tapered at both ends. This shape decreases the drag on the body as it moves through water and allows the animal to swim at high speeds. [link] lists the maximum speed of various animals. Certain types of sharks can swim at fifty kilometers an hour and some dolphins at 32 to 40 kilometers per hour. Land animals frequently travel faster, although the tortoise and snail are significantly slower than cheetahs. Another difference in the adaptations of aquatic and land-dwelling organisms is that aquatic organisms are constrained in shape by the forces of drag in the water since water has higher viscosity than air. On the other hand, land-dwelling organisms are constrained mainly by gravity, and drag is relatively unimportant. For example, most adaptations in birds are for gravity not for drag.

Maximum Speed of Assorted Land Marine Animals
Animal Speed (kmh) Speed (mph)
Cheetah 113 70
Quarter horse 77 48
Fox 68 42
Shortfin mako shark 50 31
Domestic house cat 48 30
Human 45 28
Dolphin 32–40 20–25
Mouse 13 8
Snail 0.05 0.03

Questions & Answers

how do you get the 2/50
Abba Reply
number of sport play by 50 student construct discrete data
Aminu Reply
width of the frangebany leaves on how to write a introduction
Theresa Reply
Solve the mean of variance
Veronica Reply
Step 1: Find the mean. To find the mean, add up all the scores, then divide them by the number of scores. ... Step 2: Find each score's deviation from the mean. ... Step 3: Square each deviation from the mean. ... Step 4: Find the sum of squares. ... Step 5: Divide the sum of squares by n – 1 or N.
kenneth
what is error
Yakuba Reply
Is mistake done to something
Vutshila
Hy
anas
hy
What is the life teble
anas
hy
Jibrin
statistics is the analyzing of data
Tajudeen Reply
what is statics?
Zelalem Reply
how do you calculate mean
Gloria Reply
diveving the sum if all values
Shaynaynay
let A1,A2 and A3 events be independent,show that (A1)^c, (A2)^c and (A3)^c are independent?
Fisaye Reply
what is statistics
Akhisani Reply
data collected all over the world
Shaynaynay
construct a less than and more than table
Imad Reply
The sample of 16 students is taken. The average age in the sample was 22 years with astandard deviation of 6 years. Construct a 95% confidence interval for the age of the population.
Aschalew Reply
Bhartdarshan' is an internet-based travel agency wherein customer can see videos of the cities they plant to visit. The number of hits daily is a normally distributed random variable with a mean of 10,000 and a standard deviation of 2,400 a. what is the probability of getting more than 12,000 hits? b. what is the probability of getting fewer than 9,000 hits?
Akshay Reply
Bhartdarshan'is an internet-based travel agency wherein customer can see videos of the cities they plan to visit. The number of hits daily is a normally distributed random variable with a mean of 10,000 and a standard deviation of 2,400. a. What is the probability of getting more than 12,000 hits
Akshay
1
Bright
Sorry i want to learn more about this question
Bright
Someone help
Bright
a= 0.20233 b=0.3384
Sufiyan
a
Shaynaynay
How do I interpret level of significance?
Mohd Reply
It depends on your business problem or in Machine Learning you could use ROC- AUC cruve to decide the threshold value
Shivam
how skewness and kurtosis are used in statistics
Owen Reply
yes what is it
Taneeya
Got questions? Join the online conversation and get instant answers!
Jobilize.com Reply

Get Jobilize Job Search Mobile App in your pocket Now!

Get it on Google Play Download on the App Store Now


Source:  OpenStax, Biology. OpenStax CNX. Feb 29, 2016 Download for free at http://cnx.org/content/col11448/1.10
Google Play and the Google Play logo are trademarks of Google Inc.

Notification Switch

Would you like to follow the 'Biology' conversation and receive update notifications?

Ask