<< Chapter < Page Chapter >> Page >
By the end of this section, you will be able to:
  • Explain how the structure of DNA reveals the replication process
  • Describe the Meselson and Stahl experiments

The elucidation of the structure of the double helix provided a hint as to how DNA divides and makes copies of itself. This model suggests that the two strands of the double helix separate during replication, and each strand serves as a template from which the new complementary strand is copied. What was not clear was how the replication took place. There were three models suggested ( [link] ): conservative, semi-conservative, and dispersive.

Illustration shows the conservative, semi-conservative, and dispersive models of DNA synthesis. In the conservative model, when DNA is replicated and both newly synthesized strands are paired together. In the semi-conservative model, each newly synthesized strand pairs with a parent strand. In the dispersive model, newly synthesized DNA is interspersed with parent DNA within both DNA strands.
The three suggested models of DNA replication. Grey indicates the original DNA strands, and blue indicates newly synthesized DNA.

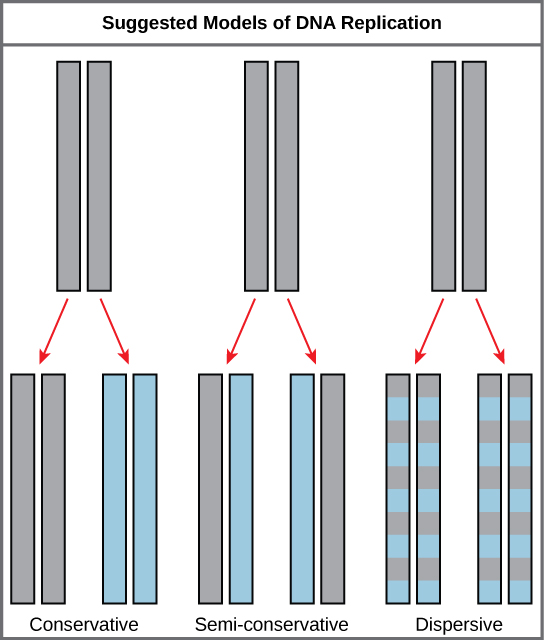
In conservative replication, the parental DNA remains together, and the newly formed daughter strands are together. The semi-conservative method suggests that each of the two parental DNA strands act as a template for new DNA to be synthesized; after replication, each double-stranded DNA includes one parental or “old” strand and one “new” strand. In the dispersive model, both copies of DNA have double-stranded segments of parental DNA and newly synthesized DNA interspersed.

Meselson and Stahl were interested in understanding how DNA replicates. They grew E. coli for several generations in a medium containing a “heavy” isotope of nitrogen ( 15 N) that gets incorporated into nitrogenous bases, and eventually into the DNA ( [link] ).

Illustration shows an experiment in which E. coli was grown initially in media containing ^{15}N nucleotides. When the DNA was extracted and run in an ultracentrifuge, a band of DNA appeared low in the tube. The culture was next placed in ^{14}N medium. After one generation, all of the DNA appeared in the middle of the tube, indicating that the DNA was a mixture of half ^{14}N and half ^{15}N DNA. After two generations, half of the DNA appeared in the middle of the tube, and half appeared higher up, indicating that half the DNA contained 50% ^{15}N, and half contained ^{14}N only. In subsequent generations, more and more of the DNA appeared in the upper, ^{14}N band.
Meselson and Stahl experimented with E. coli grown first in heavy nitrogen ( 15 N) then in 14 N. DNA grown in 15 N (red band) is heavier than DNA grown in 14 N (orange band), and sediments to a lower level in cesium chloride solution in an ultracentrifuge. When DNA grown in 15 N is switched to media containing 14 N, after one round of cell division the DNA sediments halfway between the 15 N and 14 N levels, indicating that it now contains fifty percent 14 N. In subsequent cell divisions, an increasing amount of DNA contains 14 N only. This data supports the semi-conservative replication model. (credit: modification of work by Mariana Ruiz Villareal)

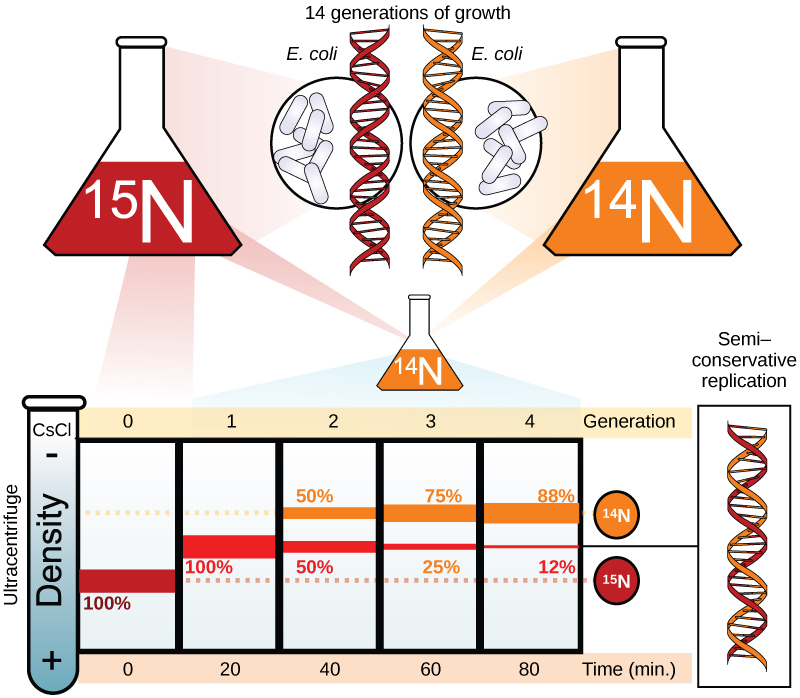
The E. coli culture was then shifted into medium containing 14 N and allowed to grow for one generation. The cells were harvested and the DNA was isolated. The DNA was centrifuged at high speeds in an ultracentrifuge. Some cells were allowed to grow for one more life cycle in 14 N and spun again. During the density gradient centrifugation, the DNA is loaded into a gradient (typically a salt such as cesium chloride or sucrose) and spun at high speeds of 50,000 to 60,000 rpm. Under these circumstances, the DNA will form a band according to its density in the gradient. DNA grown in 15 N will band at a higher density position than that grown in 14 N. Meselson and Stahl noted that after one generation of growth in 14 N after they had been shifted from 15 N, the single band observed was intermediate in position in between DNA of cells grown exclusively in 15 N and 14 N. This suggested either a semi-conservative or dispersive mode of replication. The DNA harvested from cells grown for two generations in 14 N formed two bands: one DNA band was at the intermediate position between 15 N and 14 N, and the other corresponded to the band of 14 N DNA. These results could only be explained if DNA replicates in a semi-conservative manner. Therefore, the other two modes were ruled out.

During DNA replication, each of the two strands that make up the double helix serves as a template from which new strands are copied. The new strand will be complementary to the parental or “old” strand. When two daughter DNA copies are formed, they have the same sequence and are divided equally into the two daughter cells.

Click through this tutorial on DNA replication.

Section summary

The model for DNA replication suggests that the two strands of the double helix separate during replication, and each strand serves as a template from which the new complementary strand is copied. In conservative replication, the parental DNA is conserved, and the daughter DNA is newly synthesized. The semi-conservative method suggests that each of the two parental DNA strands acts as template for new DNA to be synthesized; after replication, each double-stranded DNA includes one parental or “old” strand and one “new” strand. The dispersive mode suggested that the two copies of the DNA would have segments of parental DNA and newly synthesized DNA.

Questions & Answers

differentiate between demand and supply giving examples
Lambiv Reply
differentiated between demand and supply using examples
Lambiv
what is labour ?
Lambiv
how will I do?
Venny Reply
how is the graph works?I don't fully understand
Rezat Reply
information
Eliyee
devaluation
Eliyee
t
WARKISA
hi guys good evening to all
Lambiv
multiple choice question
Aster Reply
appreciation
Eliyee
explain perfect market
Lindiwe Reply
In economics, a perfect market refers to a theoretical construct where all participants have perfect information, goods are homogenous, there are no barriers to entry or exit, and prices are determined solely by supply and demand. It's an idealized model used for analysis,
Ezea
What is ceteris paribus?
Shukri Reply
other things being equal
AI-Robot
When MP₁ becomes negative, TP start to decline. Extuples Suppose that the short-run production function of certain cut-flower firm is given by: Q=4KL-0.6K2 - 0.112 • Where is quantity of cut flower produced, I is labour input and K is fixed capital input (K-5). Determine the average product of lab
Kelo
Extuples Suppose that the short-run production function of certain cut-flower firm is given by: Q=4KL-0.6K2 - 0.112 • Where is quantity of cut flower produced, I is labour input and K is fixed capital input (K-5). Determine the average product of labour (APL) and marginal product of labour (MPL)
Kelo
yes,thank you
Shukri
Can I ask you other question?
Shukri
what is monopoly mean?
Habtamu Reply
What is different between quantity demand and demand?
Shukri Reply
Quantity demanded refers to the specific amount of a good or service that consumers are willing and able to purchase at a give price and within a specific time period. Demand, on the other hand, is a broader concept that encompasses the entire relationship between price and quantity demanded
Ezea
ok
Shukri
how do you save a country economic situation when it's falling apart
Lilia Reply
what is the difference between economic growth and development
Fiker Reply
Economic growth as an increase in the production and consumption of goods and services within an economy.but Economic development as a broader concept that encompasses not only economic growth but also social & human well being.
Shukri
production function means
Jabir
What do you think is more important to focus on when considering inequality ?
Abdisa Reply
any question about economics?
Awais Reply
sir...I just want to ask one question... Define the term contract curve? if you are free please help me to find this answer 🙏
Asui
it is a curve that we get after connecting the pareto optimal combinations of two consumers after their mutually beneficial trade offs
Awais
thank you so much 👍 sir
Asui
In economics, the contract curve refers to the set of points in an Edgeworth box diagram where both parties involved in a trade cannot be made better off without making one of them worse off. It represents the Pareto efficient allocations of goods between two individuals or entities, where neither p
Cornelius
In economics, the contract curve refers to the set of points in an Edgeworth box diagram where both parties involved in a trade cannot be made better off without making one of them worse off. It represents the Pareto efficient allocations of goods between two individuals or entities,
Cornelius
Suppose a consumer consuming two commodities X and Y has The following utility function u=X0.4 Y0.6. If the price of the X and Y are 2 and 3 respectively and income Constraint is birr 50. A,Calculate quantities of x and y which maximize utility. B,Calculate value of Lagrange multiplier. C,Calculate quantities of X and Y consumed with a given price. D,alculate optimum level of output .
Feyisa Reply
Answer
Feyisa
c
Jabir
the market for lemon has 10 potential consumers, each having an individual demand curve p=101-10Qi, where p is price in dollar's per cup and Qi is the number of cups demanded per week by the i th consumer.Find the market demand curve using algebra. Draw an individual demand curve and the market dema
Gsbwnw Reply
suppose the production function is given by ( L, K)=L¼K¾.assuming capital is fixed find APL and MPL. consider the following short run production function:Q=6L²-0.4L³ a) find the value of L that maximizes output b)find the value of L that maximizes marginal product
Abdureman
types of unemployment
Yomi Reply
What is the difference between perfect competition and monopolistic competition?
Mohammed
Got questions? Join the online conversation and get instant answers!
Jobilize.com Reply

Get Jobilize Job Search Mobile App in your pocket Now!

Get it on Google Play Download on the App Store Now


Source:  OpenStax, Biology. OpenStax CNX. Feb 29, 2016 Download for free at http://cnx.org/content/col11448/1.10
Google Play and the Google Play logo are trademarks of Google Inc.

Notification Switch

Would you like to follow the 'Biology' conversation and receive update notifications?

Ask