

| << Chapter < Page | Chapter >> Page > |
Scientists measure the age of rocks using the properties of natural radioactivity . Around the beginning of the twentieth century, physicists began to understand that some atomic nuclei are not stable but can split apart (decay) spontaneously into smaller nuclei. The process of radioactive decay involves the emission of particles such as electrons, or of radiation in the form of gamma rays (see the chapter on Radiation and Spectra ).
For any one radioactive nucleus, it is not possible to predict when the decay process will happen. Such decay is random in nature, like the throw of dice: as gamblers have found all too often, it is impossible to say just when the dice will come up 7 or 11. But, for a very large number of dice tosses, we can calculate the odds that 7 or 11 will come up. Similarly, if we have a very large number of radioactive atoms of one type (say, uranium), there is a specific time period, called its half-life , during which the chances are fifty-fifty that decay will occur for any of the nuclei.
A particular nucleus may last a shorter or longer time than its half-life, but in a large sample, almost exactly half of the nuclei will have decayed after a time equal to one half-life. Half of the remaining nuclei will have decayed after two half-lives pass, leaving only one half of a half—or one quarter—of the original sample ( [link] ).
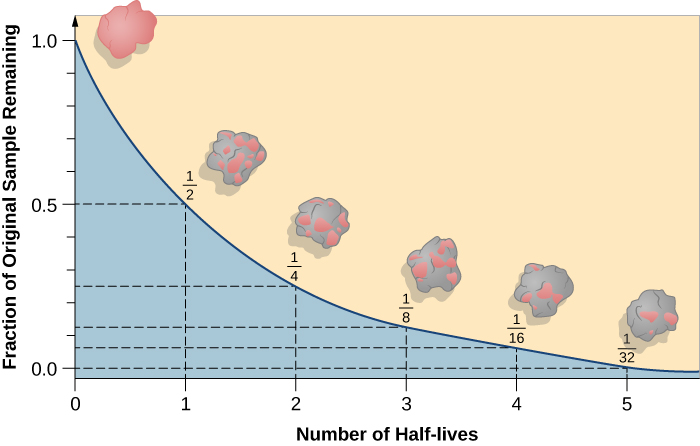
If you had 1 gram of pure radioactive nuclei with a half-life of 100 years, then after 100 years you would have
1/2 gram; after 200 years, 1/4 gram; after 300 years, only 1/8 gram; and so forth. However, the material does not disappear. Instead, the radioactive atoms are replaced with their decay products. Sometimes the radioactive atoms are called
parents and the decay products are called
daughter elements.
In this way, radioactive elements with half-lives we have determined can provide accurate nuclear clocks. By comparing how much of a radioactive parent element is left in a rock to how much of its daughter products have accumulated, we can learn how long the decay process has been going on and hence how long ago the rock formed. [link] summarizes the decay reactions used most often to date lunar and terrestrial rocks.
| Radioactive Decay Reaction Used to Date Rocks The number after each element is its atomic weight, equal to the number of protons plus neutrons in its nucleus. This specifies the isotope of the element; different isotopes of the same element differ in the number of neutrons. | ||
|---|---|---|
| Parent | Daughter | Half-Life (billions of years) |
| Samarium-147 | Neodymium-143 | 106 |
| Rubidium-87 | Strontium-87 | 48.8 |
| Thorium-232 | Lead-208 | 14.0 |
| Uranium-238 | Lead-206 | 4.47 |
| Potassium-40 | Argon-40 | 1.31 |
PBS provides an evolution series excerpt that explains how we use radioactive elements to date Earth.
This Science Channel video features Bill Nye the Science Guy showing how scientists have used radioactive dating to determine the age of Earth.
When astronauts first flew to the Moon, one of their most important tasks was to bring back lunar rocks for radioactive age-dating. Until then, astronomers and geologists had no reliable way to measure the age of the lunar surface. Counting craters had let us calculate relative ages (for example, the heavily cratered lunar highlands were older than the dark lava plains), but scientists could not measure the actual age in years. Some thought that the ages were as young as those of Earth’s surface, which has been resurfaced by many geological events. For the Moon’s surface to be so young would imply active geology on our satellite. Only in 1969, when the first Apollo samples were dated, did we learn that the Moon is an ancient, geologically dead world. Using such dating techniques, we have been able to determine the ages of both Earth and the Moon: each was formed about 4.5 billion years ago (although, as we shall see, Earth probably formed earlier).
We should also note that the decay of radioactive nuclei generally releases energy in the form of heat. Although the energy from a single nucleus is not very large (in human terms), the enormous numbers of radioactive nuclei in a planet or moon (especially early in its existence) can be a significant source of internal energy for that world. Geologists estimate that about half of Earth’s current internal heat budget comes from the decay of radioactive isotopes in its interior.
The ages of the surfaces of objects in the solar system can be estimated by counting craters: on a given world, a more heavily cratered region will generally be older than one that is less cratered. We can also use samples of rocks with radioactive elements in them to obtain the time since the layer in which the rock formed last solidified. The half-life of a radioactive element is the time it takes for half the sample to decay; we determine how many half-lives have passed by how much of a sample remains the radioactive element and how much has become the decay product. In this way, we have estimated the age of the Moon and Earth to be roughly 4.5 billion years.
Notification Switch
Would you like to follow the 'Astronomy' conversation and receive update notifications?

|
|

|
|

|
|

|
|

|
|
|
|
|

|
|

|
|
|
|
|

|