

| << Chapter < Page | Chapter >> Page > |
Several decades of careful observations have now shown that the Crab Nebula pulsar is not a perfectly regular clock as we originally thought: instead, it is gradually slowing down. Having measured how much the pulsar is slowing down, we can calculate how much rotation energy the neutron star is losing. Remember that it is very densely packed and spins amazingly quickly. Even a tiny slowing down can mean an immense loss of energy.
To the satisfaction of astronomers, the rotational energy lost by the pulsar turns out to be the same as the amount of energy emerging from the nebula surrounding it. In other words, the slowing down of a rotating neutron star can explain precisely why the Crab Nebula is glowing with the amount of energy we observe.
From observations of the pulsar s discovered so far, astronomers have concluded that one new pulsar is born somewhere in the Galaxy every 25 to 100 years, the same rate at which supernovae are estimated to occur. Calculations suggest that the typical lifetime of a pulsar is about 10 million years; after that, the neutron star no longer rotates fast enough to produce significant beams of particles and energy, and is no longer observable. We estimate that there are about 100 million neutron stars in our Galaxy, most of them rotating too slowly to come to our notice.
The Crab pulsar is rather young (only about 960 years old) and has a short period, whereas other, older pulsars have already slowed to longer periods. Pulsars thousands of years old have lost too much energy to emit appreciably in the visible and X-ray wavelengths, and they are observed only as radio pulsars; their periods are a second or longer.
There is one other reason we can see only a fraction of the pulsars in the Galaxy. Consider our lighthouse model again. On Earth, all ships approach on the same plane—the surface of the ocean—so the lighthouse can be built to sweep its beam over that surface. But in space, objects can be anywhere in three dimensions. As a given pulsar’s beam sweeps over a circle in space, there is absolutely no guarantee that this circle will include the direction of Earth. In fact, if you think about it, many more circles in space will not include Earth than will include it. Thus, we estimate that we are unable to observe a large number of neutron stars because their pulsar beams miss us entirely.
At the same time, it turns out that only a few of the pulsars discovered so far are embedded in the visible clouds of gas that mark the remnant of a supernova. This might at first seem mysterious, since we know that supernovae give rise to neutron stars and we should expect each pulsar to have begun its life in a supernova explosion. But the lifetime of a pulsar turns out to be about 100 times longer than the length of time required for the expanding gas of a supernova remnant to disperse into interstellar space. Thus, most pulsars are found with no other trace left of the explosion that produced them.
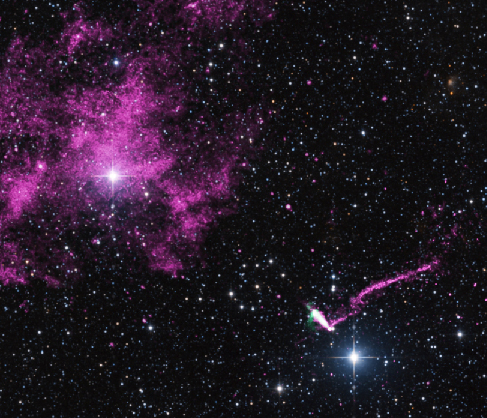
In addition, some pulsars are ejected by a supernova explosion that is not the same in all directions. If the supernova explosion is stronger on one side, it can kick the pulsar entirely out of the supernova remnant (some astronomers call this “getting a birth kick”). We know such kicks happen because we see a number of young supernova remnants in nearby galaxies where the pulsar is to one side of the remnant and racing away at several hundred miles per second ( [link] ).
On December 27, 2004, Earth was bathed with a stream of X-ray and gamma-ray radiation from a neutron star known as SGR 1806-20. What made this event so remarkable was that, despite the distance of the source, its tidal wave of radiation had measurable effects on Earth’s atmosphere. The apparent brightness of this gamma-ray flare was greater than any historical star explosion.
The primary effect of the radiation was on a layer high in Earth’s atmosphere called the ionosphere . At night, the ionosphere is normally at a height of about 85 kilometers, but during the day, energy from the Sun ionizes more molecules and lowers the boundary of the ionosphere to a height of about 60 kilometers. The pulse of X-ray and gamma-ray radiation produced about the same level of ionization as the daytime Sun. It also caused some sensitive satellites above the atmosphere to shut down their electronics.
Measurements by telescopes in space indicate that SGR 1806-20 was a special type of fast-spinning neutron star called a magnetar . Astronomers Robert Duncan and Christopher Thomson gave them this name because their magnetic fields are stronger than that of any other type of astronomical source—in this case, about 800 trillion times stronger than the magnetic field of Earth.
A magnetar is thought to consist of a superdense core of neutrons surrounded by a rigid crust of atoms about a mile deep with a surface made of iron. The magnetar’s field is so strong that it creates huge stresses inside that can sometimes crack open the hard crust, causing a starquarke. The vibrating crust produces an enormous blast of radiation. An astronaut 0.1 light-year from this particular magnetar would have received a fatal does from the blast in less than a second.
Fortunately, we were far enough away from magnetar SGR 1806-20 to be safe. Could a magnetar ever present a real danger to Earth? To produce enough energy to disrupt the ozone layer, a magnetar would have to be located within the cloud of comets that surround the solar system, and we know no magnetars are that close. Nevertheless, it is a fascinating discovery that events on distant star corpses can have measurable effects on Earth.
At least some supernovae leave behind a highly magnetic, rapidly rotating neutron star, which can be observed as a pulsar if its beam of escaping particles and focused radiation is pointing toward us. Pulsars emit rapid pulses of radiation at regular intervals; their periods are in the range of 0.001 to 10 seconds. The rotating neutron star acts like a lighthouse, sweeping its beam in a circle and giving us a pulse of radiation when the beam sweeps over Earth. As pulsars age, they lose energy, their rotations slow, and their periods increase.
Notification Switch
Would you like to follow the 'Astronomy' conversation and receive update notifications?

|
|

|
|

|
|

|
|

|
|
|
|
|

|
|

|
|

|
|

|