

| << Chapter < Page | Chapter >> Page > |
By the end of this section, you will be able to:
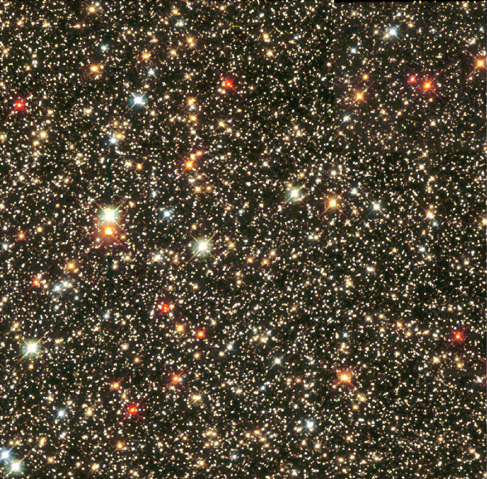
Look at the beautiful picture of the stars in the Sagittarius Star Cloud shown in [link] . The stars show a multitude of colors, including red, orange, yellow, white, and blue. As we have seen, stars are not all the same color because they do not all have identical temperatures. To define color precisely, astronomers have devised quantitative methods for characterizing the color of a star and then using those colors to determine stellar temperatures. In the chapters that follow, we will provide the temperature of the stars we are describing, and this section tells you how those temperatures are determined from the colors of light the stars give off.
As we learned in The Electromagnetic Spectrum section, Wien’s law relates stellar color to stellar temperature . Blue colors dominate the visible light output of very hot stars (with much additional radiation in the ultraviolet). On the other hand, cool stars emit most of their visible light energy at red wavelengths (with more radiation coming off in the infrared) ( [link] ). The color of a star therefore provides a measure of its intrinsic or true surface temperature (apart from the effects of reddening by interstellar dust, which will be discussed in Between the Stars: Gas and Dust in Space ). Color does not depend on the distance to the object. This should be familiar to you from everyday experience. The color of a traffic signal, for example, appears the same no matter how far away it is. If we could somehow take a star, observe it, and then move it much farther away, its apparent brightness (magnitude) would change. But this change in brightness is the same for all wavelengths, and so its color would remain the same.
| Example Star Colors and Corresponding Approximate Temperatures | ||
|---|---|---|
| Star Color | Approximate Temperature | Example |
| Blue | 25,000 K | Spica |
| White | 10,000 K | Vega |
| Yellow | 6000 K | Sun |
| Orange | 4000 K | Aldebaran |
| Red | 3000 K | Betelgeuse |
Go to this interactive simulation from the University of Colorado to see the color of a star changing as the temperature is changed.
The hottest stars have temperatures of over 40,000 K, and the coolest stars have temperatures of about 2000 K. Our Sun’s surface temperature is about 6000 K; its peak wavelength color is a slightly greenish-yellow. In space, the Sun would look white, shining with about equal amounts of reddish and bluish wavelengths of light. It looks somewhat yellow as seen from Earth’s surface because our planet’s nitrogen molecules scatter some of the shorter (i.e., blue) wavelengths out of the beams of sunlight that reach us, leaving more long wavelength light behind. This also explains why the sky is blue: the blue sky is sunlight scattered by Earth’s atmosphere.
In order to specify the exact color of a star, astronomers normally measure a star’s apparent brightness through filters, each of which transmits only the light from a particular narrow band of wavelengths (colors). A crude example of a filter in everyday life is a green-colored, plastic, soft drink bottle, which, when held in front of your eyes, lets only the green colors of light through.
One commonly used set of filters in astronomy measures stellar brightness at three wavelengths corresponding to ultraviolet, blue, and yellow light. The filters are named: U (ultraviolet), B (blue), and V (visual, for yellow). These filters transmit light near the wavelengths of 360 nanometers (nm), 420 nm, and 540 nm, respectively. The brightness measured through each filter is usually expressed in magnitudes. The difference between any two of these magnitudes—say, between the blue and the visual magnitudes (B–V)—is called a color index .
Go to this light and filters simulator for a demonstration of how different light sources and filters can combine to determine the observed spectrum. You can also see how the perceived colors are associated with the spectrum.
By agreement among astronomers, the ultraviolet, blue, and visual magnitudes of the UBV system are adjusted to give a color index of 0 to a star with a surface temperature of about 10,000 K, such as Vega . The B–V color indexes of stars range from −0.4 for the bluest stars, with temperatures of about 40,000 K, to +2.0 for the reddest stars, with temperatures of about 2000 K. The B–V index for the Sun is about +0.65. Note that, by convention, the B–V index is always the “bluer” minus the “redder” color.
Why use a color index if it ultimately implies temperature? Because the brightness of a star through a filter is what astronomers actually measure, and we are always more comfortable when our statements have to do with measurable quantities.
Stars have different colors, which are indicators of temperature. The hottest stars tend to appear blue or blue-white, whereas the coolest stars are red. A color index of a star is the difference in the magnitudes measured at any two wavelengths and is one way that astronomers measure and express the temperature of stars.
Notification Switch
Would you like to follow the 'Astronomy' conversation and receive update notifications?

|
|

|
|

|
|
|
|
|

|
|

|
|

|
|

|
|

|
|

|