| << Chapter < Page | Chapter >> Page > |

Mendel’s observation of pea plants also included many crosses that involved multiple traits, which prompted him to formulate the principle of independent assortment. The law states that the members of one pair of genes (alleles) from a parent will sort independently from other pairs of genes during the formation of gametes. Applied to pea plants, that means that the alleles associated with the different traits of the plant, such as color, height, or seed type, will sort independently of one another. This holds true except when two alleles happen to be located close to one other on the same chromosome. Independent assortment provides for a great degree of diversity in offspring.
Mendelian genetics represent the fundamentals of inheritance, but there are two important qualifiers to consider when applying Mendel’s findings to inheritance studies in humans. First, as we’ve already noted, not all genes are inherited in a dominant–recessive pattern. Although all diploid individuals have two alleles for every gene, allele pairs may interact to create several types of inheritance patterns, including incomplete dominance and codominance.
Secondly, Mendel performed his studies using thousands of pea plants. He was able to identify a 3:1 phenotypic ratio in second-generation offspring because his large sample size overcame the influence of variability resulting from chance. In contrast, no human couple has ever had thousands of children. If we know that a man and woman are both heterozygous for a recessive genetic disorder, we would predict that one in every four of their children would be affected by the disease. In real life, however, the influence of chance could change that ratio significantly. For example, if a man and a woman are both heterozygous for cystic fibrosis, a recessive genetic disorder that is expressed only when the individual has two defective alleles, we would expect one in four of their children to have cystic fibrosis. However, it is entirely possible for them to have seven children, none of whom is affected, or for them to have two children, both of whom are affected. For each individual child, the presence or absence of a single gene disorder depends on which alleles that child inherits from his or her parents.
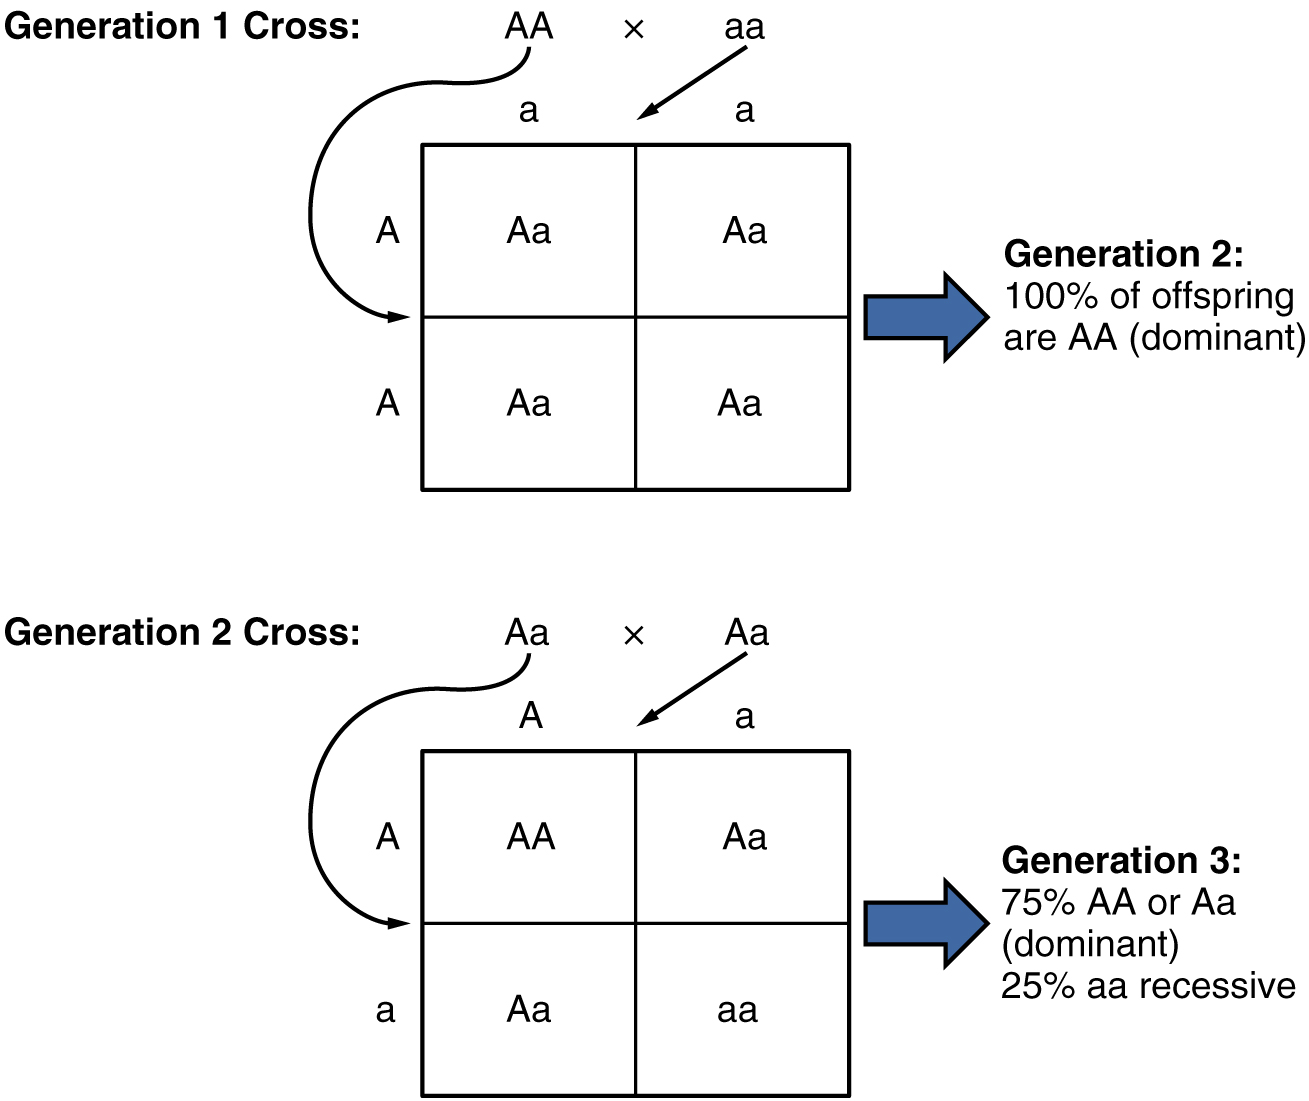
In the case of cystic fibrosis, the disorder is recessive to the normal phenotype. However, a genetic abnormality may be dominant to the normal phenotype. When the dominant allele is located on one of the 22 pairs of autosomes (non-sex chromosomes), we refer to its inheritance pattern as autosomal dominant . An example of an autosomal dominant disorder is neurofibromatosis type I, a disease that induces tumor formation within the nervous system that leads to skin and skeletal deformities. Consider a couple in which one parent is heterozygous for this disorder (and who therefore has neurofibromatosis), Nn , and one parent is homozygous for the normal gene, nn . The heterozygous parent would have a 50 percent chance of passing the dominant allele for this disorder to his or her offspring, and the homozygous parent would always pass the normal allele. Therefore, four possible offspring genotypes are equally likely to occur: Nn , Nn , nn , and nn . That is, every child of this couple would have a 50 percent chance of inheriting neurofibromatosis. This inheritance pattern is shown in [link] , in a form called a Punnett square , named after its creator, the British geneticist Reginald Punnett.

Notification Switch
Would you like to follow the 'Anatomy & Physiology' conversation and receive update notifications?