<< Chapter < Page Chapter >> Page >
The figure shows two number lines. The number line on the left is labeled x is less than a. The number line shows a parenthesis at a and an arrow that points to the left. The number line on the right is labeled x is less than or equal to a. The number line shows a bracket at a and an arrow that points to the left.

Similarly, for an inequality in two variables, the boundary line is shown with a solid or dashed line to indicate whether or not it the line is included in the solution. This is summarized in [link]

A x + B y < C A x + B y C
A x + B y > C A x + B y C
Boundary line is not included in solution. Boundary line is included in solution.
Boundary line is dashed. Boundary line is solid.

Now, let’s take a look at what we found in [link] . We’ll start by graphing the line y = x + 4 , and then we’ll plot the five points we tested. See [link] .

The graph shows the x y-coordinate plane. The x- and y-axes each run from negative 10 to 10. The line y equals x plus 4 is plotted as an arrow extending from the bottom left toward the upper right. The following points are plotted and labeled (negative 8, 12), (1, 6), (2, 6), (0, 0), and (negative 5, negative 15).

In [link] we found that some of the points were solutions to the inequality y > x + 4 and some were not.

Which of the points we plotted are solutions to the inequality y > x + 4 ? The points ( 1 , 6 ) and ( −8 , 12 ) are solutions to the inequality y > x + 4 . Notice that they are both on the same side of the boundary line y = x + 4 .

The two points ( 0 , 0 ) and ( −5 , −15 ) are on the other side of the boundary line     y = x + 4 , and they are not solutions to the inequality y > x + 4 . For those two points, y < x + 4 .

What about the point ( 2 , 6 ) ? Because 6 = 2 + 4 , the point is a solution to the equation y = x + 4 . So the point ( 2 , 6 ) is on the boundary line.

Let’s take another point on the left side of the boundary line and test whether or not it is a solution to the inequality y > x + 4 . The point ( 0 , 10 ) clearly looks to be to the left of the boundary line, doesn’t it? Is it a solution to the inequality?

y > x + 4 10 > ? 0 + 4 10 > 4 So , ( 0 , 10 ) is a solution to y > x + 4 .

Any point you choose on the left side of the boundary line is a solution to the inequality y > x + 4 . All points on the left are solutions.

Similarly, all points on the right side of the boundary line, the side with ( 0 , 0 ) and ( −5 , −15 ) , are not solutions to y > x + 4 . See [link] .

The graph shows the x y-coordinate plane. The x- and y-axes each run from negative 10 to 10. The line y equals x plus 4 is plotted as an arrow extending from the bottom left toward the upper right. The following points are plotted and labeled (negative 8, 12), (1, 6), (2, 6), (0, 0), and (negative 5, negative 15). To the upper left of the line is the inequality y is greater than x plus 4. To the right of the line is the inequality y is less than x plus 4.

The graph of the inequality y > x + 4 is shown in [link] below. The line y = x + 4 divides the plane into two regions. The shaded side shows the solutions to the inequality y > x + 4 .

The points on the boundary line, those where y = x + 4 , are not solutions to the inequality y > x + 4 , so the line itself is not part of the solution. We show that by making the line dashed, not solid.
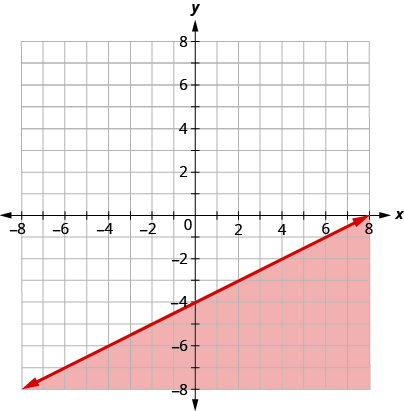
The graph shows the x y-coordinate plane. The x- and y-axes each run from negative 10 to 10. The line y equals x plus 4 is plotted as a dashed arrow extending from the bottom left toward the upper right. The coordinate plane to the upper left of the line is shaded.
The graph of the inequality y > x + 4 .

The boundary line shown is y = 2 x 1 . Write the inequality shown by the graph.

The graph shows the x y-coordinate plane. The x- and y-axes each run from negative 10 to 10. The line y equals 2 x minus 1 is plotted as a solid arrow extending from the bottom left toward the upper right. The coordinate plane to the left of the line is shaded

Solution

The line y = 2 x 1 is the boundary line. On one side of the line are the points with y > 2 x 1 and on the other side of the line are the points with y < 2 x 1 .

Let’s test the point ( 0 , 0 ) and see which inequality describes its side of the boundary line.

At ( 0 , 0 ) , which inequality is true:

y > 2 x 1 or y < 2 x 1 ? y > 2 x 1 y < 2 x 1 0 > ? 2 · 0 1 0 < ? 2 · 0 1 0 > −1 True 0 < −1 False

Since, y > 2 x 1 is true, the side of the line with ( 0 , 0 ) , is the solution. The shaded region shows the solution of the inequality y > 2 x 1 .

Since the boundary line is graphed with a solid line, the inequality includes the equal sign.

The graph shows the inequality y 2 x 1 .

We could use any point as a test point, provided it is not on the line. Why did we choose ( 0 , 0 ) ? Because it’s the easiest to evaluate. You may want to pick a point on the other side of the boundary line and check that y < 2 x 1 .

Got questions? Get instant answers now!

Write the inequality shown by the graph with the boundary line y = −2 x + 3 .

The graph shows the x y-coordinate plane. The x- and y-axes each run from negative 10 to 10. The line y equals negative 2 x plus 3 is plotted as a solid arrow extending from the top left toward the bottom right. The coordinate plane to the right of the line is shaded.

y −2 x + 3

Got questions? Get instant answers now!

Write the inequality shown by the graph with the boundary line y = 1 2 x 4 .

The graph shows the x y-coordinate plane. The x- and y-axes each run from negative 10 to 10. The line y equals one half x minus 4 is plotted as a solid arrow extending from the bottom left toward the top right. The coordinate plane to the bottom right of the line is shaded.

y < 1 2 x 4

Got questions? Get instant answers now!

Questions & Answers

how did the oxygen help a human being
Achol Reply
how did the nutrition help the plants
Achol Reply
Biology is a branch of Natural science which deals/About living Organism.
Ahmedin Reply
what is phylogeny
Odigie Reply
evolutionary history and relationship of an organism or group of organisms
AI-Robot
ok
Deng
what is biology
Hajah Reply
cell is the smallest unit of the humanity biologically
Abraham
what is biology
Victoria Reply
what is biology
Abraham
HOW CAN MAN ORGAN FUNCTION
Alfred Reply
the diagram of the digestive system
Assiatu Reply
allimentary cannel
Ogenrwot
How does twins formed
William Reply
They formed in two ways first when one sperm and one egg are splited by mitosis or two sperm and two eggs join together
Oluwatobi
what is genetics
Josephine Reply
Genetics is the study of heredity
Misack
how does twins formed?
Misack
What is manual
Hassan Reply
discuss biological phenomenon and provide pieces of evidence to show that it was responsible for the formation of eukaryotic organelles
Joseph Reply
what is biology
Yousuf Reply
the study of living organisms and their interactions with one another and their environment.
Wine
discuss the biological phenomenon and provide pieces of evidence to show that it was responsible for the formation of eukaryotic organelles in an essay form
Joseph Reply
what is the blood cells
Shaker Reply
list any five characteristics of the blood cells
Shaker
Got questions? Join the online conversation and get instant answers!
Jobilize.com Reply
Practice Key Terms 3

Get Jobilize Job Search Mobile App in your pocket Now!

Get it on Google Play Download on the App Store Now


Source:  OpenStax, Elementary algebra. OpenStax CNX. Jan 18, 2017 Download for free at http://cnx.org/content/col12116/1.2
Google Play and the Google Play logo are trademarks of Google Inc.

Notification Switch

Would you like to follow the 'Elementary algebra' conversation and receive update notifications?

Ask