-
Home
- College algebra
- Functions
- Functions and function notation
We will see these toolkit functions, combinations of toolkit functions, their graphs, and their transformations frequently throughout this book. It will be very helpful if we can recognize these toolkit functions and their features quickly by name, formula, graph, and basic table properties. The graphs and sample table values are included with each function shown in
[link] .
| Toolkit Functions |
| Name |
Function |
Graph |
| Constant |
where
is a constant |
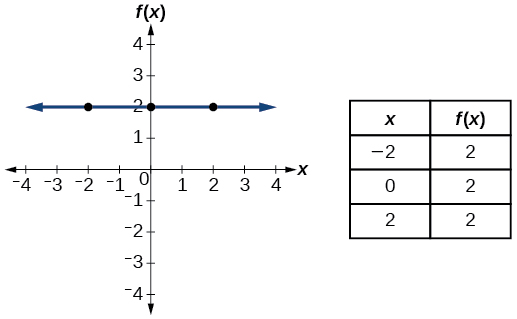 |
| Identity |
|
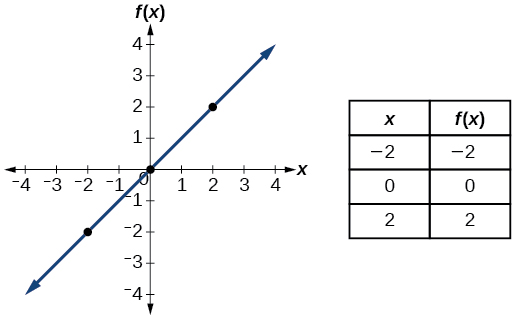 |
| Absolute value |
|
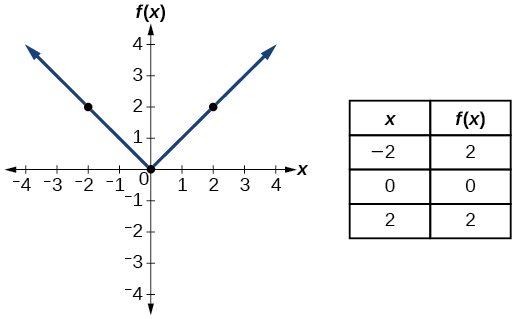 |
| Quadratic |
|
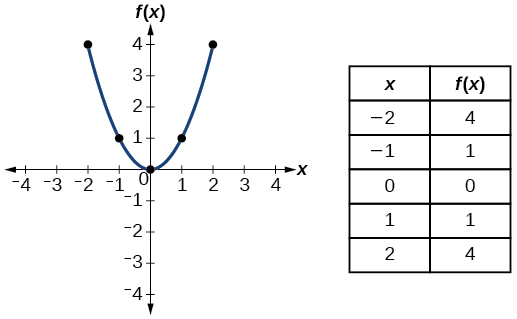 |
| Cubic |
|
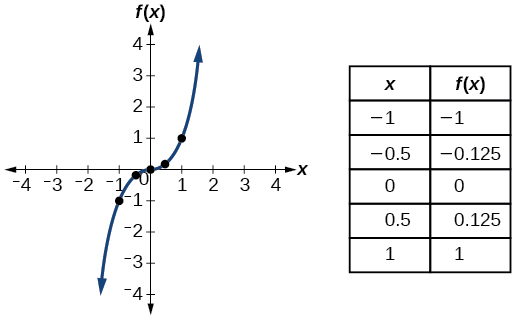 |
| Reciprocal |
|
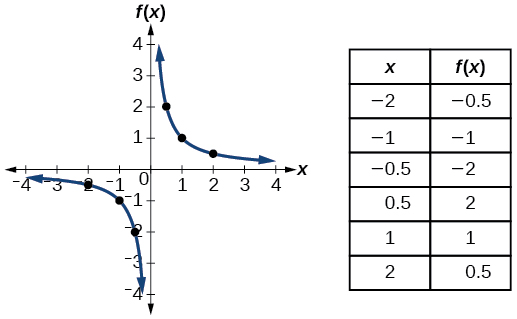 |
| Reciprocal squared |
|
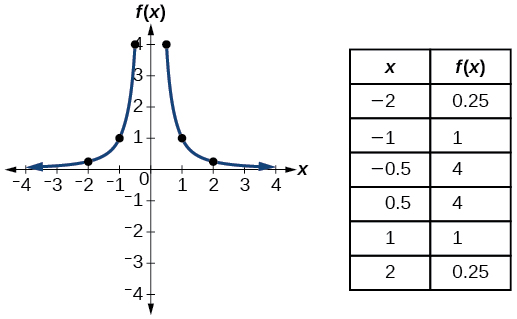 |
| Square root |
|
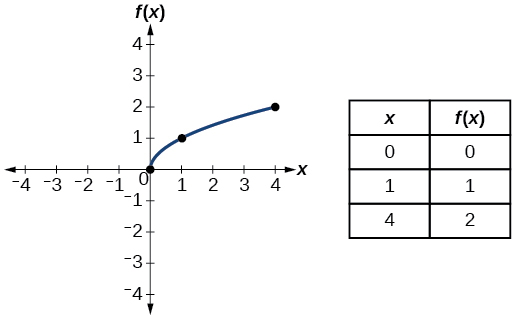 |
| Cube root |
|
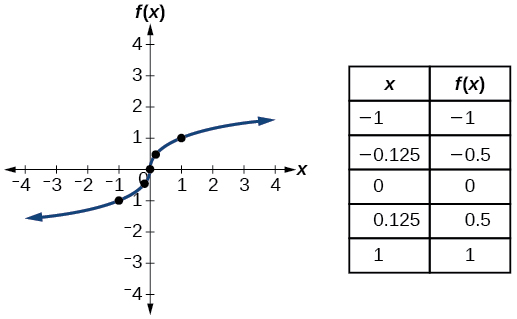 |
Key equations
| Constant function |
where
is a constant |
| Identity function |
|
| Absolute value function |
|
| Quadratic function |
|
| Cubic function |
|
| Reciprocal function |
|
| Reciprocal squared function |
|
| Square root function |
|
| Cube root function |
|
Key concepts
- A relation is a set of ordered pairs. A function is a specific type of relation in which each domain value, or input, leads to exactly one range value, or output. See
[link] and
[link] .
- Function notation is a shorthand method for relating the input to the output in the form
See
[link] and
[link] .
- In tabular form, a function can be represented by rows or columns that relate to input and output values. See
[link] .
- To evaluate a function, we determine an output value for a corresponding input value. Algebraic forms of a function can be evaluated by replacing the input variable with a given value. See
[link] and
[link] .
- To solve for a specific function value, we determine the input values that yield the specific output value. See
[link] .
- An algebraic form of a function can be written from an equation. See
[link] and
[link] .
- Input and output values of a function can be identified from a table. See
[link] .
- Relating input values to output values on a graph is another way to evaluate a function. See
[link] .
- A function is one-to-one if each output value corresponds to only one input value. See
[link] .
- A graph represents a function if any vertical line drawn on the graph intersects the graph at no more than one point. See
[link] .
- The graph of a one-to-one function passes the horizontal line test. See
[link] .
Section exercises
Verbal
What is the difference between a relation and a function?
A relation is a set of ordered pairs. A function is a special kind of relation in which no two ordered pairs have the same first coordinate.
Got questions? Get instant answers now!
Why does the vertical line test tell us whether the graph of a relation represents a function?
When a vertical line intersects the graph of a relation more than once, that indicates that for that input there is more than one output. At any particular input value, there can be only one output if the relation is to be a function.
Got questions? Get instant answers now!
Questions & Answers
Ayele, K., 2003. Introductory Economics, 3rd ed., Addis Ababa.
can you send the book attached ?
Ariel
the study of how humans make choices under conditions of scarcity
AI-Robot
U(x,y) = (x×y)1/2
find mu of x for y
U(x,y) = (xÃy)1/2
find mu of x for y
Desalegn
this is the study of how the society manages it's scarce resources
Belonwu
macroeconomic is the branch of economics which studies actions, scale, activities and behaviour of the aggregate economy as a whole.
husaini
difference between firm and industry
what's the difference between a firm and an industry
Abdul
firm is the unit which transform inputs to output where as industry contain combination of firms with similar production 😅😅
Abdulraufu
Suppose the demand function that a firm faces shifted from
Qd 120 3P
to
Qd 90 3P
and the supply function has shifted from
QS
20 2P
to
QS
10 2P .
a) Find the effect of this change on price and quantity.
b) Which of the changes in demand and supply is higher?
explain standard reason why economic is a science
factors influencing supply
scares
means__________________ends
resources. unlimited
Jan
economics is a science that studies human behaviour as a relationship b/w ends and scares means which have alternative uses
Jan
calculate the profit maximizing for demand and supply
Why qualify 28 supplies
Milan
out-of-pocket costs for a firm, for example, payments for wages and salaries, rent, or materials
AI-Robot
concepts of supply in microeconomics
identify a demand and a supply curve
there's a difference
Aryan
Demand curve shows that how supply and others conditions affect on demand of a particular thing and what percent demand increase whith increase of supply of goods
Israr
Hi Sir please how do u calculate Cross elastic demand and income elastic demand?
Abari
Got questions? Join the online conversation and get instant answers!
Source:
OpenStax, College algebra. OpenStax CNX. Feb 06, 2015 Download for free at https://legacy.cnx.org/content/col11759/1.3
Google Play and the Google Play logo are trademarks of Google Inc.