<< Chapter < Page Chapter >> Page >

Sketching the graph of a polynomial function

Sketch a graph of f ( x ) = −2 ( x + 3 ) 2 ( x 5 ) .

This graph has two x -intercepts. At x = −3 , the factor is squared, indicating a multiplicity of 2. The graph will bounce at this x -intercept. At x = 5 , the function has a multiplicity of one, indicating the graph will cross through the axis at this intercept.

The y -intercept is found by evaluating f ( 0 ) .

f ( 0 ) = −2 ( 0 + 3 ) 2 ( 0 5 ) = −2 9 ( −5 ) = 90

The y -intercept is ( 0 , 90 ) .

Additionally, we can see the leading term, if this polynomial were multiplied out, would be 2 x 3 , so the end behavior is that of a vertically reflected cubic, with the outputs decreasing as the inputs approach infinity, and the outputs increasing as the inputs approach negative infinity. See [link] .
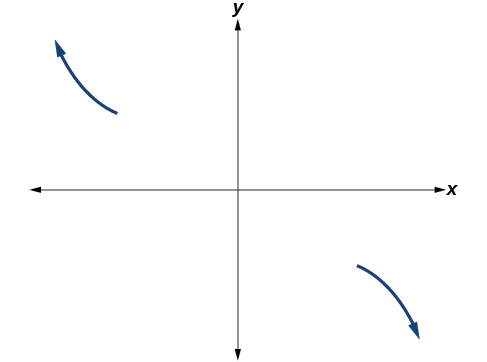
Showing the distribution for the leading term.

To sketch this, we consider that:

  • As x the function f ( x ) , so we know the graph starts in the second quadrant and is decreasing toward the x - axis.
  • Since f ( x ) = −2 ( x + 3 ) 2 ( x 5 ) is not equal to f ( x ) , the graph does not display symmetry.
  • At ( 3 , 0 ) , the graph bounces off of the x -axis, so the function must start increasing.

    At ( 0 , 90 ) , the graph crosses the y -axis at the y -intercept. See [link] .
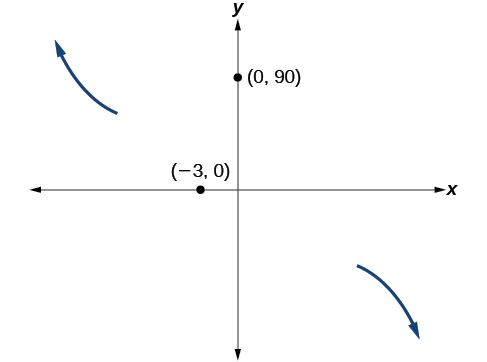
Graph of the end behavior and intercepts, (-3, 0) and (0, 90), for the function f(x)=-2(x+3)^2(x-5).

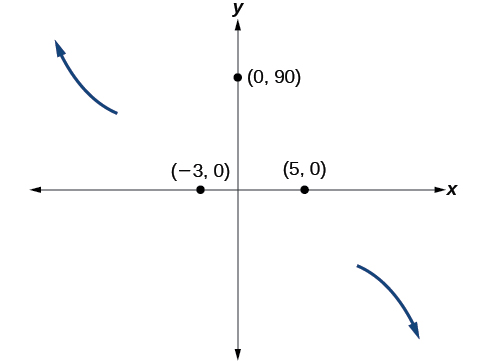
Somewhere after this point, the graph must turn back down or start decreasing toward the horizontal axis because the graph passes through the next intercept at ( 5 , 0 ) . See [link] .

Graph of the end behavior and intercepts, (-3, 0), (0, 90) and (5, 0), for the function f(x)=-2(x+3)^2(x-5).

As x the function f ( x ) −∞ , so we know the graph continues to decrease, and we can stop drawing the graph in the fourth quadrant.

Using technology, we can create the graph for the polynomial function, shown in [link] , and verify that the resulting graph looks like our sketch in [link] .
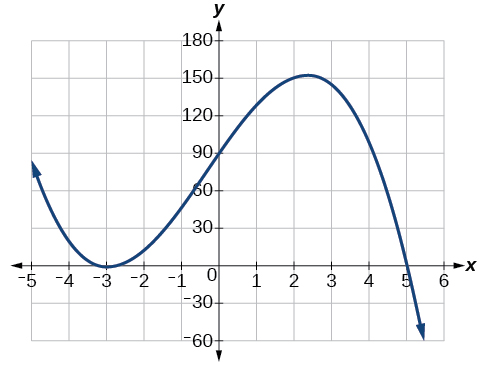
Graph of f(x)=-2(x+3)^2(x-5).
The complete graph of the polynomial function f ( x ) = 2 ( x + 3 ) 2 ( x 5 )
Got questions? Get instant answers now!

Sketch a graph of f ( x ) = 1 4 x ( x 1 ) 4 ( x + 3 ) 3 .

Graph of f(x)=(1/4)x(x-1)^4(x+3)^3.

Got questions? Get instant answers now!

Using the intermediate value theorem

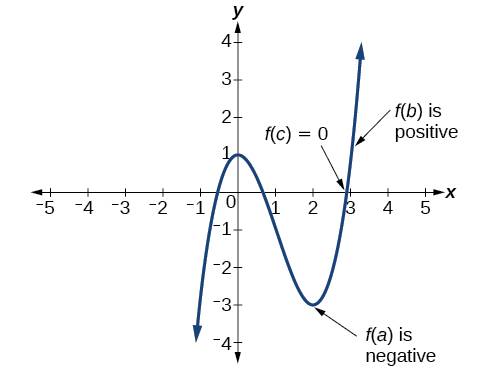
In some situations, we may know two points on a graph but not the zeros. If those two points are on opposite sides of the x -axis, we can confirm that there is a zero between them. Consider a polynomial function f whose graph is smooth and continuous. The Intermediate Value Theorem    states that for two numbers a and b in the domain of f , if a < b and f ( a ) f ( b ) , then the function f takes on every value between f ( a ) and f ( b ) . (While the theorem is intuitive, the proof is actually quite complicated and requires higher mathematics.) We can apply this theorem to a special case that is useful in graphing polynomial functions. If a point on the graph of a continuous function f at x = a lies above the x - axis and another point at x = b lies below the x - axis, there must exist a third point between x = a and x = b where the graph crosses the x - axis. Call this point ( c ,   f ( c ) ) . This means that we are assured there is a solution c where f ( c ) = 0.

In other words, the Intermediate Value Theorem tells us that when a polynomial function changes from a negative value to a positive value, the function must cross the x - axis. [link] shows that there is a zero between a and b .

Graph of an odd-degree polynomial function that shows a point f(a) that’s negative, f(b) that’s positive, and f(c) that’s 0.
Using the Intermediate Value Theorem to show there exists a zero.

Intermediate value theorem

Let f be a polynomial function. The Intermediate Value Theorem    states that if f ( a ) and f ( b ) have opposite signs, then there exists at least one value c between a and b for which f ( c ) = 0.

Questions & Answers

what's Thermochemistry
rhoda Reply
the study of the heat energy which is associated with chemical reactions
Kaddija
How was CH4 and o2 was able to produce (Co2)and (H2o
Edafe Reply
explain please
Victory
First twenty elements with their valences
Martine Reply
what is chemistry
asue Reply
what is atom
asue
what is the best way to define periodic table for jamb
Damilola Reply
what is the change of matter from one state to another
Elijah Reply
what is isolation of organic compounds
IKyernum Reply
what is atomic radius
ThankGod Reply
Read Chapter 6, section 5
Dr
Read Chapter 6, section 5
Kareem
Atomic radius is the radius of the atom and is also called the orbital radius
Kareem
atomic radius is the distance between the nucleus of an atom and its valence shell
Amos
Read Chapter 6, section 5
paulino
Bohr's model of the theory atom
Ayom Reply
is there a question?
Dr
when a gas is compressed why it becomes hot?
ATOMIC
It has no oxygen then
Goldyei
read the chapter on thermochemistry...the sections on "PV" work and the First Law of Thermodynamics should help..
Dr
Which element react with water
Mukthar Reply
Mgo
Ibeh
an increase in the pressure of a gas results in the decrease of its
Valentina Reply
definition of the periodic table
Cosmos Reply
What is the lkenes
Da Reply
what were atoms composed of?
Moses Reply
what is chemistry
Imoh Reply
what is chemistry
Damilola
Got questions? Join the online conversation and get instant answers!
Jobilize.com Reply
Practice Key Terms 4

Get Jobilize Job Search Mobile App in your pocket Now!

Get it on Google Play Download on the App Store Now


Source:  OpenStax, College algebra. OpenStax CNX. Feb 06, 2015 Download for free at https://legacy.cnx.org/content/col11759/1.3
Google Play and the Google Play logo are trademarks of Google Inc.

Notification Switch

Would you like to follow the 'College algebra' conversation and receive update notifications?

Ask