<< Chapter < Page Chapter >> Page >

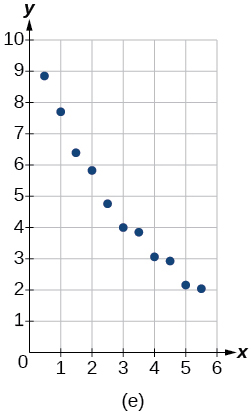
What might a scatterplot of data points look like if it were best described by a logarithmic model?

Got questions? Get instant answers now!

What does the y -intercept on the graph of a logistic equation correspond to for a population modeled by that equation?

The y -intercept on the graph of a logistic equation corresponds to the initial population for the population model.

Got questions? Get instant answers now!

Graphical

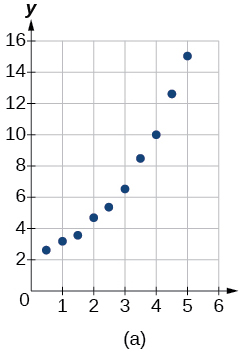
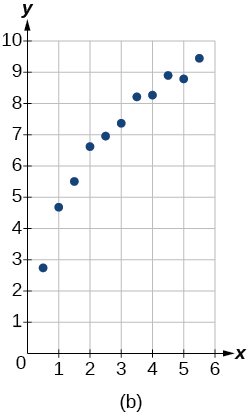
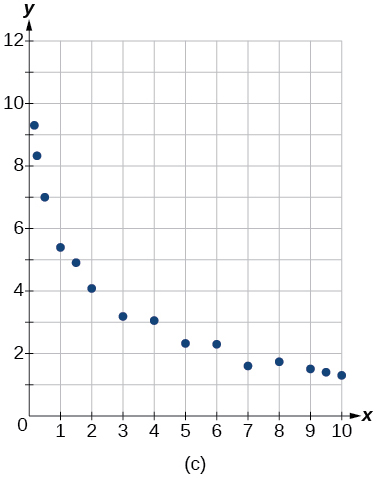
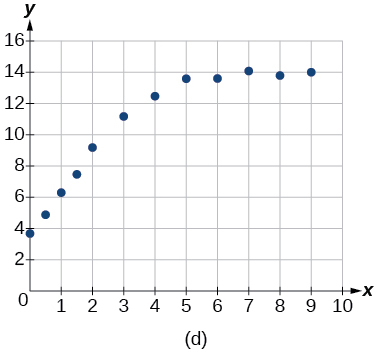
For the following exercises, match the given function of best fit with the appropriate scatterplot in [link] through [link] . Answer using the letter beneath the matching graph.

Graph of a scattered plot.

y = 10.209 e 0.294 x

Got questions? Get instant answers now!

y = 5.598 1.912 ln ( x )

C

Got questions? Get instant answers now!

y = 4.607 + 2.733 ln ( x )

B

Got questions? Get instant answers now!

y = 14.005 1 + 2.79 e 0.812 x

Got questions? Get instant answers now!

Numeric

To the nearest whole number, what is the initial value of a population modeled by the logistic equation P ( t ) = 175 1 + 6.995 e 0.68 t ? What is the carrying capacity?

P ( 0 ) = 22 ; 175

Got questions? Get instant answers now!

Rewrite the exponential model A ( t ) = 1550 ( 1.085 ) x as an equivalent model with base e . Express the exponent to four significant digits.

Got questions? Get instant answers now!

A logarithmic model is given by the equation h ( p ) = 67.682 5.792 ln ( p ) . To the nearest hundredth, for what value of p does h ( p ) = 62 ?

p 2.67

Got questions? Get instant answers now!

A logistic model is given by the equation P ( t ) = 90 1 + 5 e 0.42 t . To the nearest hundredth, for what value of t does P ( t ) = 45 ?

Got questions? Get instant answers now!

What is the y -intercept on the graph of the logistic model given in the previous exercise?

y -intercept: ( 0 , 15 )

Got questions? Get instant answers now!

Technology

For the following exercises, use this scenario: The population P of a koi pond over x months is modeled by the function P ( x ) = 68 1 + 16 e 0.28 x .

Graph the population model to show the population over a span of 3 years.

Got questions? Get instant answers now!

What was the initial population of koi?

4 koi

Got questions? Get instant answers now!

How many koi will the pond have after one and a half years?

Got questions? Get instant answers now!

How many months will it take before there are 20 koi in the pond?

about 6.8 months.

Got questions? Get instant answers now!

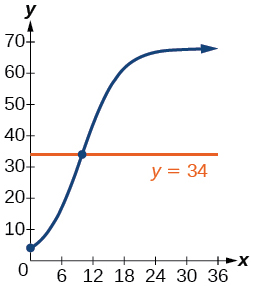
Use the intersect feature to approximate the number of months it will take before the population of the pond reaches half its carrying capacity.

Graph of the intersection of P(t)=68/(1+16e^(-0.28t)) and y=34.
Got questions? Get instant answers now!

For the following exercises, use this scenario: The population P of an endangered species habitat for wolves is modeled by the function P ( x ) = 558 1 + 54.8 e 0.462 x , where x is given in years.

Graph the population model to show the population over a span of 10 years.

Got questions? Get instant answers now!

What was the initial population of wolves transported to the habitat?

10 wolves

Got questions? Get instant answers now!

How many wolves will the habitat have after 3 years?

Got questions? Get instant answers now!

How many years will it take before there are 100 wolves in the habitat?

about 5.4 years.

Got questions? Get instant answers now!

Use the intersect feature to approximate the number of years it will take before the population of the habitat reaches half its carrying capacity.

Got questions? Get instant answers now!

For the following exercises, refer to [link] .

x f(x)
1 1125
2 1495
3 2310
4 3294
5 4650
6 6361

Use a graphing calculator to create a scatter diagram of the data.

Graph of the table’s values.
Got questions? Get instant answers now!

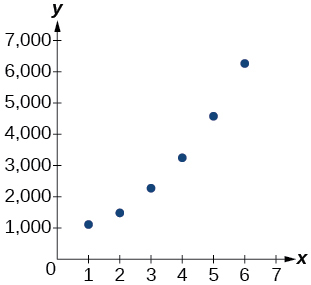
Use the regression feature to find an exponential function that best fits the data in the table.

Got questions? Get instant answers now!

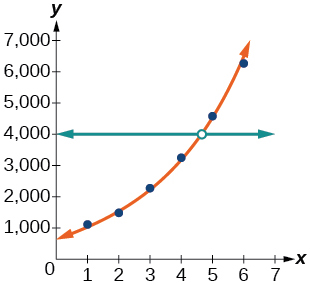
Write the exponential function as an exponential equation with base e .

f ( x ) = 776.682 e 0.3549 x

Got questions? Get instant answers now!

Graph the exponential equation on the scatter diagram.

Got questions? Get instant answers now!

Use the intersect feature to find the value of x for which f ( x ) = 4000.

When f ( x ) = 4000 , x 4.6.

Graph of the intersection of a scattered plot with an estimation line and y=4,000.
Got questions? Get instant answers now!

For the following exercises, refer to [link] .

x f(x)
1 555
2 383
3 307
4 210
5 158
6 122

Use a graphing calculator to create a scatter diagram of the data.

Got questions? Get instant answers now!

Questions & Answers

Ayele, K., 2003. Introductory Economics, 3rd ed., Addis Ababa.
Widad Reply
can you send the book attached ?
Ariel
?
Ariel
What is economics
Widad Reply
the study of how humans make choices under conditions of scarcity
AI-Robot
U(x,y) = (x×y)1/2 find mu of x for y
Desalegn Reply
U(x,y) = (x×y)1/2 find mu of x for y
Desalegn
what is ecnomics
Jan Reply
this is the study of how the society manages it's scarce resources
Belonwu
what is macroeconomic
John Reply
macroeconomic is the branch of economics which studies actions, scale, activities and behaviour of the aggregate economy as a whole.
husaini
etc
husaini
difference between firm and industry
husaini Reply
what's the difference between a firm and an industry
Abdul
firm is the unit which transform inputs to output where as industry contain combination of firms with similar production 😅😅
Abdulraufu
Suppose the demand function that a firm faces shifted from Qd  120 3P to Qd  90  3P and the supply function has shifted from QS  20  2P to QS 10  2P . a) Find the effect of this change on price and quantity. b) Which of the changes in demand and supply is higher?
Toofiq Reply
explain standard reason why economic is a science
innocent Reply
factors influencing supply
Petrus Reply
what is economic.
Milan Reply
scares means__________________ends resources. unlimited
Jan
economics is a science that studies human behaviour as a relationship b/w ends and scares means which have alternative uses
Jan
calculate the profit maximizing for demand and supply
Zarshad Reply
Why qualify 28 supplies
Milan
what are explicit costs
Nomsa Reply
out-of-pocket costs for a firm, for example, payments for wages and salaries, rent, or materials
AI-Robot
concepts of supply in microeconomics
David Reply
economic overview notes
Amahle Reply
identify a demand and a supply curve
Salome Reply
i don't know
Parul
there's a difference
Aryan
Demand curve shows that how supply and others conditions affect on demand of a particular thing and what percent demand increase whith increase of supply of goods
Israr
Hi Sir please how do u calculate Cross elastic demand and income elastic demand?
Abari
Got questions? Join the online conversation and get instant answers!
Jobilize.com Reply

Get Jobilize Job Search Mobile App in your pocket Now!

Get it on Google Play Download on the App Store Now


Source:  OpenStax, College algebra. OpenStax CNX. Feb 06, 2015 Download for free at https://legacy.cnx.org/content/col11759/1.3
Google Play and the Google Play logo are trademarks of Google Inc.

Notification Switch

Would you like to follow the 'College algebra' conversation and receive update notifications?

Ask