<< Chapter < Page Chapter >> Page >

Access this online resource for additional instruction and practice with rates of change.

Key equations

Average rate of change Δ y Δ x = f ( x 2 ) f ( x 1 ) x 2 x 1

Key concepts

  • A rate of change relates a change in an output quantity to a change in an input quantity. The average rate of change is determined using only the beginning and ending data. See [link] .
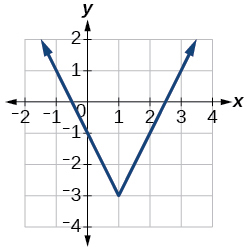
  • Identifying points that mark the interval on a graph can be used to find the average rate of change. See [link] .
  • Comparing pairs of input and output values in a table can also be used to find the average rate of change. See [link] .
  • An average rate of change can also be computed by determining the function values at the endpoints of an interval described by a formula. See [link] and [link] .
  • The average rate of change can sometimes be determined as an expression. See [link] .
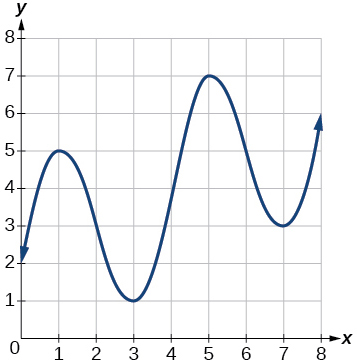
  • A function is increasing where its rate of change is positive and decreasing where its rate of change is negative. See [link] .
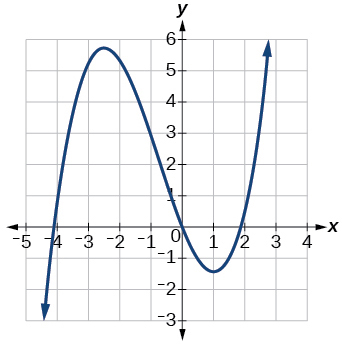
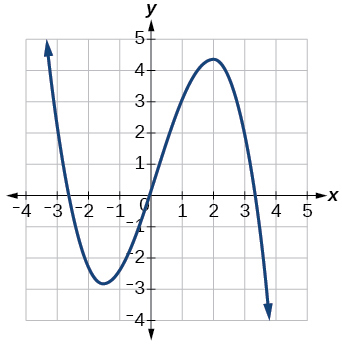
  • A local maximum is where a function changes from increasing to decreasing and has an output value larger (more positive or less negative) than output values at neighboring input values.
  • A local minimum is where the function changes from decreasing to increasing (as the input increases) and has an output value smaller (more negative or less positive) than output values at neighboring input values.
  • Minima and maxima are also called extrema.
  • We can find local extrema from a graph. See [link] and [link] .
  • The highest and lowest points on a graph indicate the maxima and minima. See [link] .

Section exercises

Verbal

Can the average rate of change of a function be constant?

Yes, the average rate of change of all linear functions is constant.

Got questions? Get instant answers now!

If a function f is increasing on ( a , b ) and decreasing on ( b , c ) , then what can be said about the local extremum of f on ( a , c ) ?

Got questions? Get instant answers now!

How are the absolute maximum and minimum similar to and different from the local extrema?

The absolute maximum and minimum relate to the entire graph, whereas the local extrema relate only to a specific region around an open interval.

Got questions? Get instant answers now!

How does the graph of the absolute value function compare to the graph of the quadratic function, y = x 2 , in terms of increasing and decreasing intervals?

Got questions? Get instant answers now!

Algebraic

For the following exercises, find the average rate of change of each function on the interval specified for real numbers b or h in simplest form.

f ( x ) = 4 x 2 7 on [ 1 ,   b ]

4 ( b + 1 )

Got questions? Get instant answers now!

g ( x ) = 2 x 2 9 on [ 4 ,   b ]

Got questions? Get instant answers now!

p ( x ) = 3 x + 4 on [ 2 ,   2 + h ]

3

Got questions? Get instant answers now!

k ( x ) = 4 x 2 on [ 3 ,   3 + h ]

Got questions? Get instant answers now!

f ( x ) = 2 x 2 + 1 on [ x , x + h ]

4 x + 2 h

Got questions? Get instant answers now!

g ( x ) = 3 x 2 2 on [ x , x + h ]

Got questions? Get instant answers now!

a ( t ) = 1 t + 4 on [ 9 , 9 + h ]

1 13 ( 13 + h )

Got questions? Get instant answers now!

b ( x ) = 1 x + 3 on [ 1 , 1 + h ]

Got questions? Get instant answers now!

j ( x ) = 3 x 3 on [ 1 , 1 + h ]

3 h 2 + 9 h + 9

Got questions? Get instant answers now!

r ( t ) = 4 t 3 on [ 2 , 2 + h ]

Got questions? Get instant answers now!

f ( x + h ) f ( x ) h given f ( x ) = 2 x 2 3 x on [ x , x + h ]

4 x + 2 h 3

Got questions? Get instant answers now!

Graphical

For the following exercises, consider the graph of f shown in [link] .

Graph of a polynomial.

Estimate the average rate of change from x = 1 to x = 4.

Got questions? Get instant answers now!

Estimate the average rate of change from x = 2 to x = 5.

4 3

Got questions? Get instant answers now!

For the following exercises, use the graph of each function to estimate the intervals on which the function is increasing or decreasing.

Graph of a cubic function.

increasing on ( , 2.5 ) ( 1 , ) , decreasing on ( 2.5 ,   1 )

Got questions? Get instant answers now!
Graph of a reciprocal function.

increasing on ( , 1 ) ( 3 , 4 ) , decreasing on ( 1 , 3 ) ( 4 , )

Got questions? Get instant answers now!

For the following exercises, consider the graph shown in [link] .

Questions & Answers

Ayele, K., 2003. Introductory Economics, 3rd ed., Addis Ababa.
Widad Reply
can you send the book attached ?
Ariel
?
Ariel
What is economics
Widad Reply
the study of how humans make choices under conditions of scarcity
AI-Robot
U(x,y) = (x×y)1/2 find mu of x for y
Desalegn Reply
U(x,y) = (x×y)1/2 find mu of x for y
Desalegn
what is ecnomics
Jan Reply
this is the study of how the society manages it's scarce resources
Belonwu
what is macroeconomic
John Reply
macroeconomic is the branch of economics which studies actions, scale, activities and behaviour of the aggregate economy as a whole.
husaini
etc
husaini
difference between firm and industry
husaini Reply
what's the difference between a firm and an industry
Abdul
firm is the unit which transform inputs to output where as industry contain combination of firms with similar production 😅😅
Abdulraufu
Suppose the demand function that a firm faces shifted from Qd  120 3P to Qd  90  3P and the supply function has shifted from QS  20  2P to QS 10  2P . a) Find the effect of this change on price and quantity. b) Which of the changes in demand and supply is higher?
Toofiq Reply
explain standard reason why economic is a science
innocent Reply
factors influencing supply
Petrus Reply
what is economic.
Milan Reply
scares means__________________ends resources. unlimited
Jan
economics is a science that studies human behaviour as a relationship b/w ends and scares means which have alternative uses
Jan
calculate the profit maximizing for demand and supply
Zarshad Reply
Why qualify 28 supplies
Milan
what are explicit costs
Nomsa Reply
out-of-pocket costs for a firm, for example, payments for wages and salaries, rent, or materials
AI-Robot
concepts of supply in microeconomics
David Reply
economic overview notes
Amahle Reply
identify a demand and a supply curve
Salome Reply
i don't know
Parul
there's a difference
Aryan
Demand curve shows that how supply and others conditions affect on demand of a particular thing and what percent demand increase whith increase of supply of goods
Israr
Hi Sir please how do u calculate Cross elastic demand and income elastic demand?
Abari
Got questions? Join the online conversation and get instant answers!
Jobilize.com Reply
Practice Key Terms 9

Get Jobilize Job Search Mobile App in your pocket Now!

Get it on Google Play Download on the App Store Now


Source:  OpenStax, College algebra. OpenStax CNX. Feb 06, 2015 Download for free at https://legacy.cnx.org/content/col11759/1.3
Google Play and the Google Play logo are trademarks of Google Inc.

Notification Switch

Would you like to follow the 'College algebra' conversation and receive update notifications?

Ask