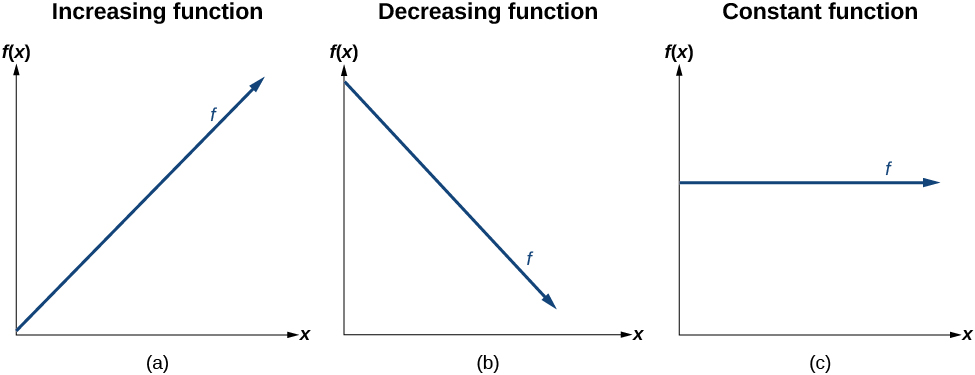
The slope determines if the function is an
increasing linear function , a
decreasing linear function , or a constant function.
is an increasing function if
is a decreasing function if
is a constant function if
Deciding whether a function is increasing, decreasing, or constant
Some recent studies suggest that a teenager sends an average of 60 texts per day
http://www.cbsnews.com/8301-501465_162-57400228-501465/teens-are-sending-60-texts-a-day-study-says/ . For each of the following scenarios, find the linear function that describes the relationship between the input value and the output value. Then, determine whether the graph of the function is increasing, decreasing, or constant.
The total number of texts a teen sends is considered a function of time in days. The input is the number of days, and output is the total number of texts sent.
A teen has a limit of 500 texts per month in his or her data plan. The input is the number of days, and output is the total number of texts remaining for the month.
A teen has an unlimited number of texts in his or her data plan for a cost of $50 per month. The input is the number of days, and output is the total cost of texting each month.
Analyze each function.
The function can be represented as
where
is the number of days. The slope, 60, is positive so the function is increasing. This makes sense because the total number of texts increases with each day.
The function can be represented as
where
is the number of days. In this case, the slope is negative so the function is decreasing. This makes sense because the number of texts remaining decreases each day and this function represents the number of texts remaining in the data plan after
days.
The cost function can be represented as
because the number of days does not affect the total cost. The slope is 0 so the function is constant.
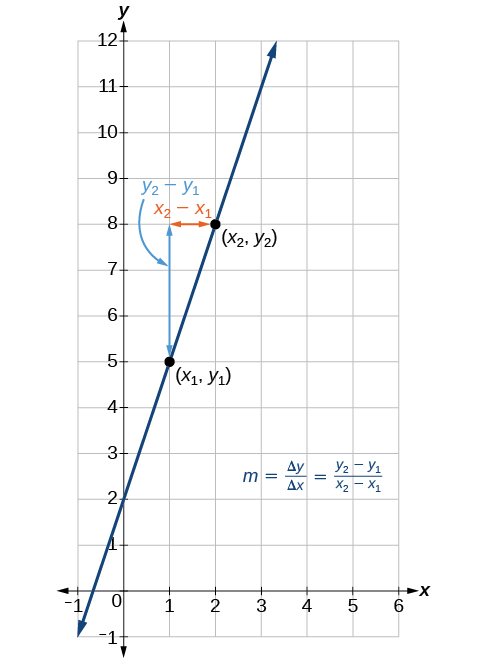
In the examples we have seen so far, the slope was provided to us. However, we often need to calculate the slope given input and output values. Recall that given two values for the input,
and
and two corresponding values for the output,
and
—which can be represented by a set of points,
and
—we can calculate the slope
Note that in function notation we can obtain two corresponding values for the output
and
for the function
and
so we could equivalently write
[link] indicates how the slope of the line between the points,
and
is calculated. Recall that the slope measures steepness, or slant. The greater the absolute value of the slope, the steeper the slant is.
The slope of a function is calculated by the change in
divided by the change in
It does not matter which coordinate is used as the
and which is the
as long as each calculation is started with the elements from the same coordinate pair.
Step 1: Find the mean. To find the mean, add up all the scores, then divide them by the number of scores. ...
Step 2: Find each score's deviation from the mean. ...
Step 3: Square each deviation from the mean. ...
Step 4: Find the sum of squares. ...
Step 5: Divide the sum of squares by n – 1 or N.
The sample of 16 students is taken. The average age in the sample was 22 years with astandard deviation of 6 years. Construct a 95% confidence interval for the age of the population.
Bhartdarshan' is an internet-based travel agency wherein customer can see videos of the cities they plant to visit. The number of hits daily is a normally distributed random variable with a mean of 10,000 and a standard deviation of 2,400
a. what is the probability of getting more than 12,000 hits?
b. what is the probability of getting fewer than 9,000 hits?
Bhartdarshan'is an internet-based travel agency wherein customer can see videos of the cities they plan to visit. The number of hits daily is a normally distributed random variable with a mean of 10,000 and a standard deviation of 2,400.
a. What is the probability of getting more than 12,000 hits