Given a function and both a vertical and a horizontal shift, sketch the graph.
Identify the vertical and horizontal shifts from the formula.
The vertical shift results from a constant added to the output. Move the graph up for a positive constant and down for a negative constant.
The horizontal shift results from a constant added to the input. Move the graph left for a positive constant and right for a negative constant.
Apply the shifts to the graph in either order.
Graphing combined vertical and horizontal shifts
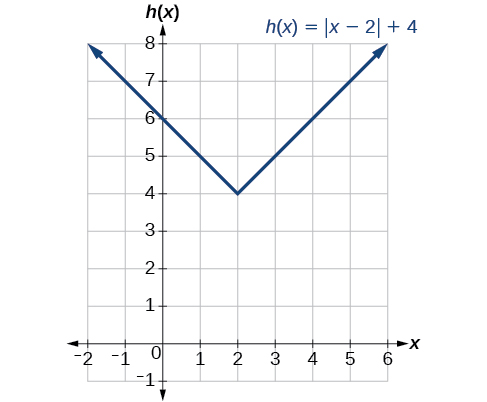
Given
sketch a graph of
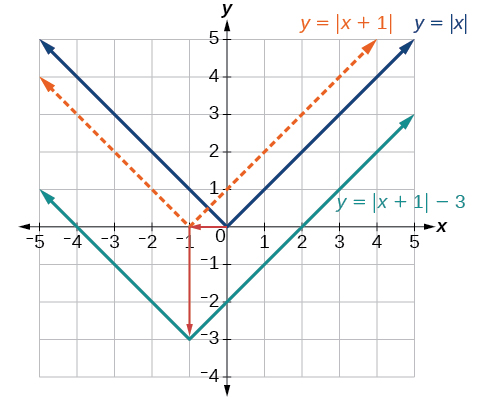
The function
is our toolkit absolute value function. We know that this graph has a V shape, with the point at the origin. The graph of
has transformed
in two ways:
is a change on the inside of the function, giving a horizontal shift left by 1, and the subtraction by 3 in
is a change to the outside of the function, giving a vertical shift down by 3. The transformation of the graph is illustrated in
[link] .
Let us follow one point of the graph of
The point
is transformed first by shifting left 1 unit:
The point
is transformed next by shifting down 3 units:
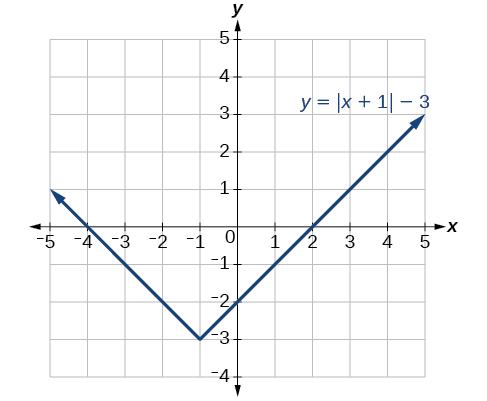
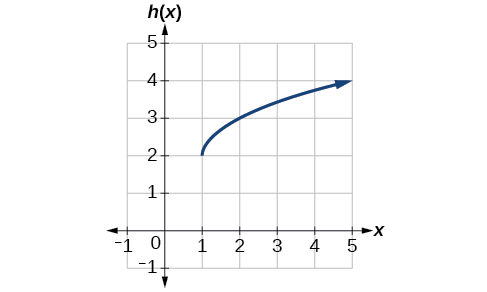
Identifying combined vertical and horizontal shifts
Write a formula for the graph shown in
[link] , which is a transformation of the toolkit square root function.
The graph of the toolkit function starts at the origin, so this graph has been shifted 1 to the right and up 2. In function notation, we could write that as
Using the formula for the square root function, we can write
Graphing functions using reflections about the axes
Another transformation that can be applied to a function is a reflection over the
x - or
y -axis. A
vertical reflection reflects a graph vertically across the
x -axis, while a
horizontal reflection reflects a graph horizontally across the
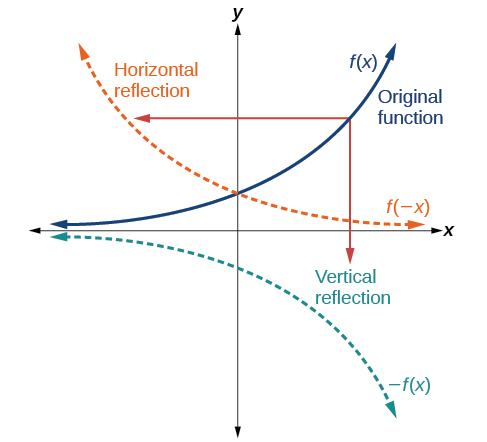
y -axis. The reflections are shown in
[link] .
Vertical and horizontal reflections of a function.
Notice that the vertical reflection produces a new graph that is a mirror image of the base or original graph about the
x -axis. The horizontal reflection produces a new graph that is a mirror image of the base or original graph about the
y -axis.
Reflections
Given a function
a new function
is a
vertical reflection of the function
sometimes called a reflection about (or over, or through) the
x -axis.
Given a function
a new function
is a
horizontal reflection of the function
sometimes called a reflection about the
y -axis.
Given a function, reflect the graph both vertically and horizontally.
Multiply all outputs by –1 for a vertical reflection. The new graph is a reflection of the original graph about the
x -axis.
Multiply all inputs by –1 for a horizontal reflection. The new graph is a reflection of the original graph about the
y -axis.
Step 1: Find the mean. To find the mean, add up all the scores, then divide them by the number of scores. ...
Step 2: Find each score's deviation from the mean. ...
Step 3: Square each deviation from the mean. ...
Step 4: Find the sum of squares. ...
Step 5: Divide the sum of squares by n – 1 or N.
The sample of 16 students is taken. The average age in the sample was 22 years with astandard deviation of 6 years. Construct a 95% confidence interval for the age of the population.
Bhartdarshan' is an internet-based travel agency wherein customer can see videos of the cities they plant to visit. The number of hits daily is a normally distributed random variable with a mean of 10,000 and a standard deviation of 2,400
a. what is the probability of getting more than 12,000 hits?
b. what is the probability of getting fewer than 9,000 hits?
Bhartdarshan'is an internet-based travel agency wherein customer can see videos of the cities they plan to visit. The number of hits daily is a normally distributed random variable with a mean of 10,000 and a standard deviation of 2,400.
a. What is the probability of getting more than 12,000 hits