

| << Chapter < Page | Chapter >> Page > |
Given a logarithmic function with the form graph the function.
Graph State the domain, range, and asymptote.
Before graphing, identify the behavior and key points for the graph.
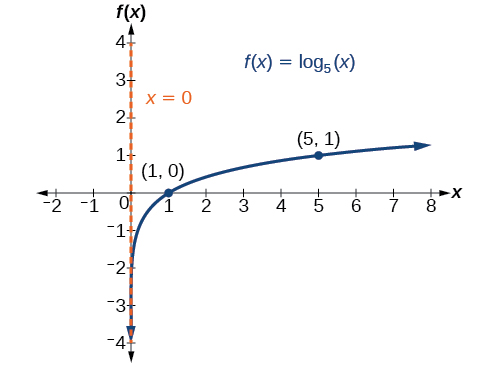
The domain is the range is and the vertical asymptote is
Graph State the domain, range, and asymptote.
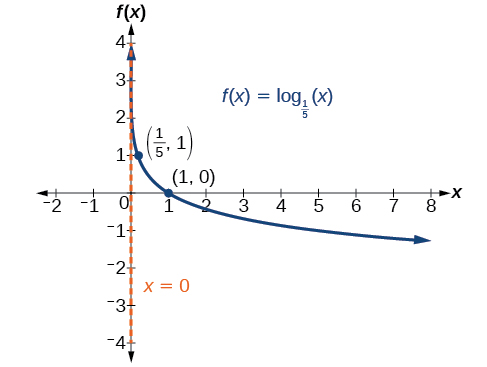
The domain is the range is and the vertical asymptote is
As we mentioned in the beginning of the section, transformations of logarithmic graphs behave similarly to those of other parent functions. We can shift, stretch, compress, and reflect the parent function without loss of shape.
When a constant is added to the input of the parent function the result is a horizontal shift units in the opposite direction of the sign on To visualize horizontal shifts, we can observe the general graph of the parent function and for alongside the shift left, and the shift right, See [link] .
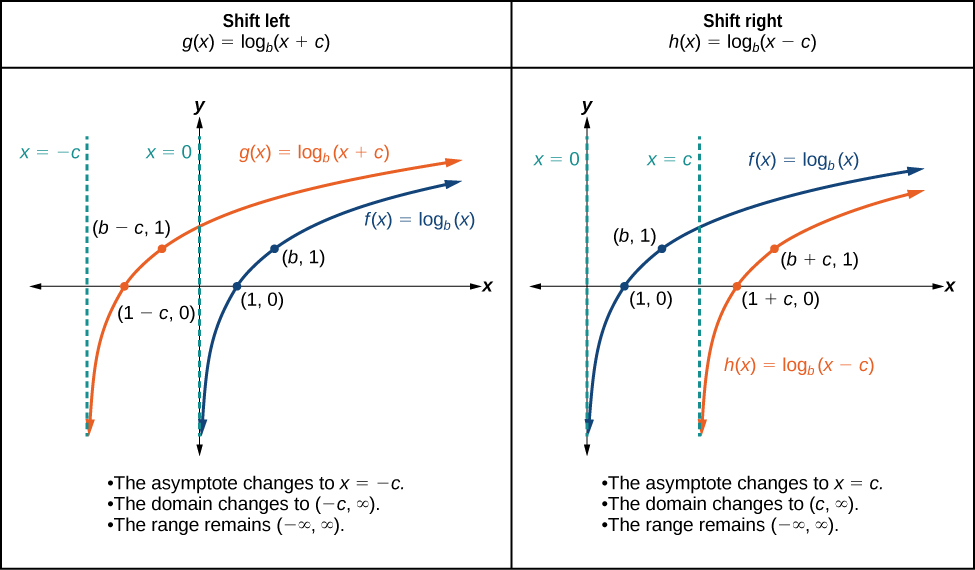
For any constant the function
Given a logarithmic function with the form graph the translation.
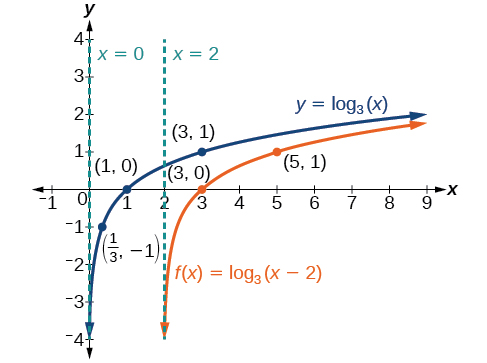
Sketch the horizontal shift alongside its parent function. Include the key points and asymptotes on the graph. State the domain, range, and asymptote.
Since the function is we notice
Thus so This means we will shift the function right 2 units.
The vertical asymptote is or
Consider the three key points from the parent function, and
The new coordinates are found by adding 2 to the coordinates.
Label the points and
The domain is the range is and the vertical asymptote is
Notification Switch
Would you like to follow the 'College algebra' conversation and receive update notifications?

|
|
|
|
|

|
|

|
|

|
|

|
|

|
|

|
|

|
|

|
|

|
|

|