<< Chapter < Page Chapter >> Page >
y = 2 x + 4

Given a graph of linear function, find the equation to describe the function.

  1. Identify the y- intercept of an equation.
  2. Choose two points to determine the slope.
  3. Substitute the y- intercept and slope into the slope-intercept form of a line.

Matching linear functions to their graphs

Match each equation of the linear functions with one of the lines in [link] .

a .   f ( x ) = 2 x + 3 b . g ( x ) = 2 x 3 c . h ( x ) = −2 x + 3 d j ( x ) = 1 2 x + 3
Graph of four functions where the orange line has a y-intercept at 3 and slope of 2, the baby blue line has a y-intercept at 3 and slope of 1/2, the blue line has a y-intercept at 3 and slope of -2, and the green line has a y-intercept at -3 and slope of 2.

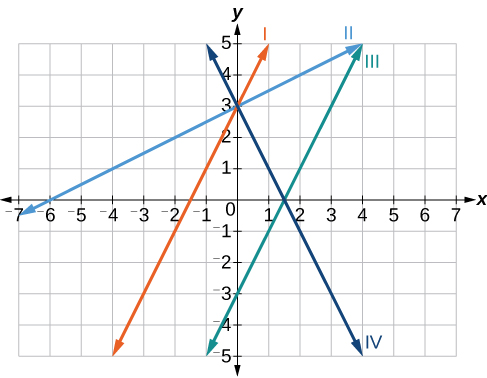
Analyze the information for each function.

  1. This function has a slope of 2 and a y -intercept of 3. It must pass through the point (0, 3) and slant upward from left to right. We can use two points to find the slope, or we can compare it with the other functions listed. Function g has the same slope, but a different y- intercept. Lines I and III have the same slant because they have the same slope. Line III does not pass through ( 0 , 3 ) so f must be represented by line I.
  2. This function also has a slope of 2, but a y -intercept of −3. It must pass through the point ( 0 , −3 ) and slant upward from left to right. It must be represented by line III.
  3. This function has a slope of –2 and a y- intercept of 3. This is the only function listed with a negative slope, so it must be represented by line IV because it slants downward from left to right.
  4. This function has a slope of 1 2 and a y- intercept of 3. It must pass through the point (0, 3) and slant upward from left to right. Lines I and II pass through ( 0 , 3 ) , but the slope of j is less than the slope of f so the line for j must be flatter. This function is represented by Line II.

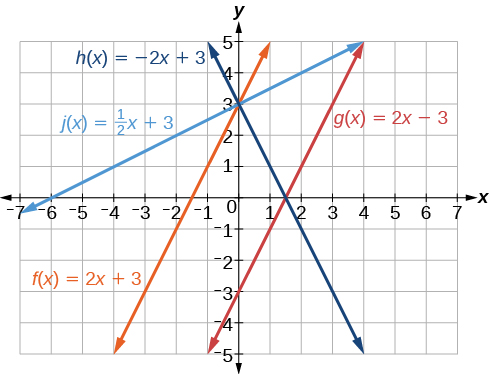
Now we can re-label the lines as in [link] .

Graph of four functions where the blue line is h(x) = -2x + 3 which goes through the point (0,3), the baby blue line is j(x) = x/2 + 3 which goes through the point (0,3). The orange line is f(x) = 2x + 3 which goes through the point (0,3), and the red line is g(x) = 2x – 3 which goes through the point (0,-3).
Got questions? Get instant answers now!

Finding the x -intercept of a line

So far we have been finding the y- intercepts of a function: the point at which the graph of the function crosses the y -axis. Recall that a function may also have an x -intercept , which is the x -coordinate of the point where the graph of the function crosses the x -axis. In other words, it is the input value when the output value is zero.

To find the x -intercept, set a function f ( x ) equal to zero and solve for the value of x . For example, consider the function shown.

f ( x ) = 3 x 6

Set the function equal to 0 and solve for x .

0 = 3 x 6 6 = 3 x 2 = x x = 2

The graph of the function crosses the x -axis at the point ( 2 , 0 ) .

Do all linear functions have x -intercepts?

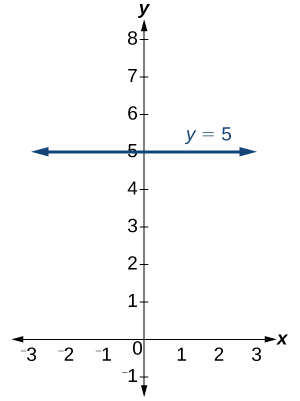
No. However, linear functions of the form y = c , where c is a nonzero real number are the only examples of linear functions with no x-intercept. For example, y = 5 is a horizontal line 5 units above the x-axis. This function has no x-intercepts, as shown in [link] .

Graph of the function y = 5, a completely horizontal line that goes through the point (0,5).  Graphed on an xy-plane with the x-axis ranging from -3 to 3 and the y-plane ranging from -1 to 8.

x -intercept

The x -intercept of the function is value of x when f ( x ) = 0. It can be solved by the equation 0 = m x + b .

Finding an x -intercept

Find the x -intercept of f ( x ) = 1 2 x 3.

Set the function equal to zero to solve for x .

0 = 1 2 x 3 3 = 1 2 x 6 = x x = 6

The graph crosses the x -axis at the point ( 6 , 0 ) .

Got questions? Get instant answers now!

Find the x -intercept of f ( x ) = 1 4 x 4.

( 16 ,  0 )

Got questions? Get instant answers now!

Describing horizontal and vertical lines

There are two special cases of lines on a graph—horizontal and vertical lines. A horizontal line    indicates a constant output, or y -value. In [link] , we see that the output has a value of 2 for every input value. The change in outputs between any two points, therefore, is 0. In the slope formula, the numerator is 0, so the slope is 0. If we use m = 0 in the equation f ( x ) = m x + b , the equation simplifies to f ( x ) = b . In other words, the value of the function is a constant. This graph represents the function f ( x ) = 2.

Questions & Answers

Ayele, K., 2003. Introductory Economics, 3rd ed., Addis Ababa.
Widad Reply
can you send the book attached ?
Ariel
?
Ariel
What is economics
Widad Reply
the study of how humans make choices under conditions of scarcity
AI-Robot
U(x,y) = (x×y)1/2 find mu of x for y
Desalegn Reply
U(x,y) = (x×y)1/2 find mu of x for y
Desalegn
what is ecnomics
Jan Reply
this is the study of how the society manages it's scarce resources
Belonwu
what is macroeconomic
John Reply
macroeconomic is the branch of economics which studies actions, scale, activities and behaviour of the aggregate economy as a whole.
husaini
etc
husaini
difference between firm and industry
husaini Reply
what's the difference between a firm and an industry
Abdul
firm is the unit which transform inputs to output where as industry contain combination of firms with similar production 😅😅
Abdulraufu
Suppose the demand function that a firm faces shifted from Qd  120 3P to Qd  90  3P and the supply function has shifted from QS  20  2P to QS 10  2P . a) Find the effect of this change on price and quantity. b) Which of the changes in demand and supply is higher?
Toofiq Reply
explain standard reason why economic is a science
innocent Reply
factors influencing supply
Petrus Reply
what is economic.
Milan Reply
scares means__________________ends resources. unlimited
Jan
economics is a science that studies human behaviour as a relationship b/w ends and scares means which have alternative uses
Jan
calculate the profit maximizing for demand and supply
Zarshad Reply
Why qualify 28 supplies
Milan
what are explicit costs
Nomsa Reply
out-of-pocket costs for a firm, for example, payments for wages and salaries, rent, or materials
AI-Robot
concepts of supply in microeconomics
David Reply
economic overview notes
Amahle Reply
identify a demand and a supply curve
Salome Reply
i don't know
Parul
there's a difference
Aryan
Demand curve shows that how supply and others conditions affect on demand of a particular thing and what percent demand increase whith increase of supply of goods
Israr
Hi Sir please how do u calculate Cross elastic demand and income elastic demand?
Abari
Got questions? Join the online conversation and get instant answers!
Jobilize.com Reply

Get Jobilize Job Search Mobile App in your pocket Now!

Get it on Google Play Download on the App Store Now


Source:  OpenStax, College algebra. OpenStax CNX. Feb 06, 2015 Download for free at https://legacy.cnx.org/content/col11759/1.3
Google Play and the Google Play logo are trademarks of Google Inc.

Notification Switch

Would you like to follow the 'College algebra' conversation and receive update notifications?

Ask