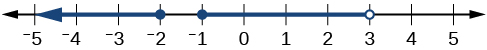
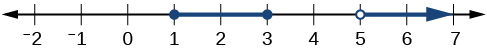
Describe the intervals of values shown in
[link] using inequality notation, set-builder notation, and interval notation.
To describe the values,
included in the intervals shown, we would say, “
is a real number greater than or equal to 1 and less than or equal to 3, or a real number greater than 5.”
Inequality
Set-builder notation
Interval notation
Remember that, when writing or reading interval notation, using a square bracket means the boundary is included in the set. Using a parenthesis means the boundary is not included in the set.
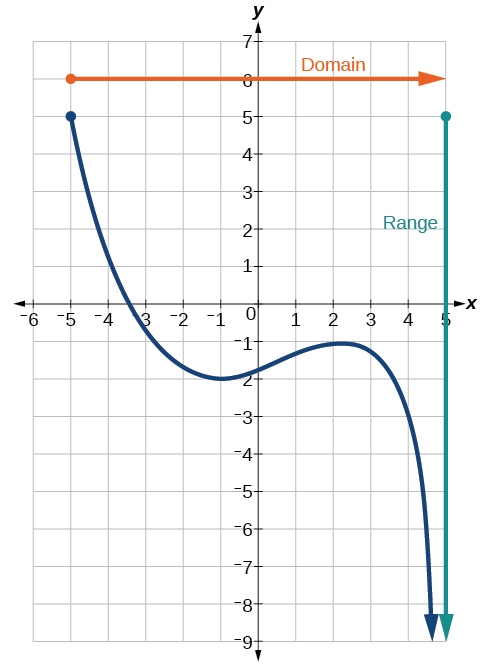
Another way to identify the domain and range of functions is by using graphs. Because the domain refers to the set of possible input values, the domain of a graph consists of all the input values shown on the
x -axis. The range is the set of possible output values, which are shown on the
y -axis. Keep in mind that if the graph continues beyond the portion of the graph we can see, the domain and range may be greater than the visible values. See
[link] .
We can observe that the graph extends horizontally from
to the right without bound, so the domain is
The vertical extent of the graph is all range values
and below, so the range is
Note that the domain and range are always written from smaller to larger values, or from left to right for domain, and from the bottom of the graph to the top of the graph for range.
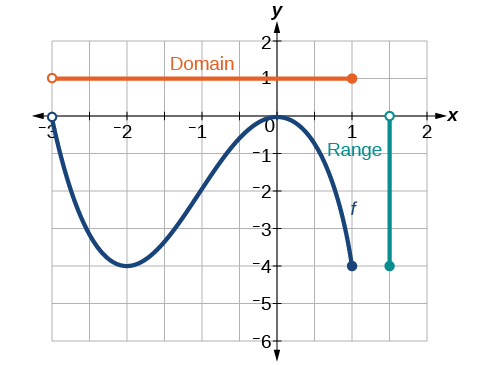
Finding domain and range from a graph
Find the domain and range of the function
whose graph is shown in
[link] .
We can observe that the horizontal extent of the graph is –3 to 1, so the domain of
is
The vertical extent of the graph is 0 to –4, so the range is
See
[link] .
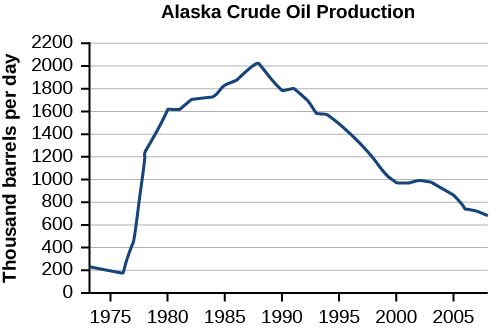
Finding domain and range from a graph of oil production
Find the domain and range of the function
whose graph is shown in
[link] .
(credit: modification of work by the U.S. Energy Information Administration)
http://www.eia.gov/dnav/pet/hist/LeafHandler.ashx?n=PET&s=MCRFPAK2&f=A.
The input quantity along the horizontal axis is “years,” which we represent with the variable
for time. The output quantity is “thousands of barrels of oil per day,” which we represent with the variable
for barrels. The graph may continue to the left and right beyond what is viewed, but based on the portion of the graph that is visible, we can determine the domain as
and the range as approximately
In interval notation, the domain is [1973, 2008], and the range is about [180, 2010]. For the domain and the range, we approximate the smallest and largest values since they do not fall exactly on the grid lines.
is it possible to leave every good at the same level
Joseph
I don't think so. because check it, if the demand for chicken increases, people will no longer consume fish like they used to causing a fall in the demand for fish
Anuolu
is not really possible to let the value of a goods to be same at the same time.....
Salome
Suppose the inflation rate is 6%, does it mean that all the goods you purchase will cost
6% more than previous year? Provide with reasoning.
Not necessarily. To measure the inflation rate economists normally use an averaged price index of a basket of certain goods. So if you purchase goods included in the basket, you will notice that you pay 6% more, otherwise not necessarily.
Good day
How do I calculate this question: C= 100+5yd G= 2000 T= 2000 I(planned)=200.
Suppose the actual output is 3000. What is the level of planned expenditures at this level of output?
I am Camara from Guinea west Africa... happy to meet you guys here
Sekou
ma management ho
Amisha
ahile becheclor ho
Amisha
hjr ktm bta ho
ani k kaam grnu hunxa tw
Amisha
belatari
Amisha
1st year ho
Amisha
nd u
Amisha
ahh
Amisha
kaha biratnagar
Amisha
ys
Amisha
kina k vo
Amisha
money as unit of account means what?
Kalombe
A unit of account is something that can be used to value goods and services and make calculations
Jim
all of you please speak in English I can't understand you're language
Muhammad
I want to know how can we define macroeconomics in one line
Muhammad
it must be .9 or 0.9
no Mpc is greater than 1
Y=100+.9Y+50
Y-.9Y=150
0.1Y/0.1=150/0.1
Y=1500
Kalombe
Mercy is it clear?😋
Kalombe
hi can someone help me on this question
If a negative shocks shifts the IS curve to the left, what type of policy do you suggest so as to stabilize the level of output?
discuss your answer using appropriate graph.


![Graph of a function from (-3, 1].](/ocw/mirror/col11759/m51262/CNX_Precalc_Figure_01_02_007.jpg)