<< Chapter < Page Chapter >> Page >

Use the graph of the function of degree 5 in [link] to identify the zeros of the function and their multiplicities.

Graph of an even-degree polynomial with degree 6.

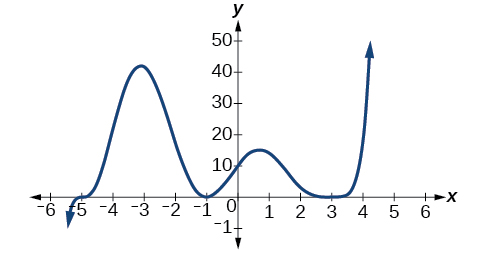
The graph has a zero of –5 with multiplicity 1, a zero of –1 with multiplicity 2, and a zero of 3 with even multiplicity.

Got questions? Get instant answers now!

Determining end behavior

As we have already learned, the behavior of a graph of a polynomial function    of the form

f ( x ) = a n x n + a n 1 x n 1 + ... + a 1 x + a 0

will either ultimately rise or fall as x increases without bound and will either rise or fall as x decreases without bound. This is because for very large inputs, say 100 or 1,000, the leading term dominates the size of the output. The same is true for very small inputs, say –100 or –1,000.

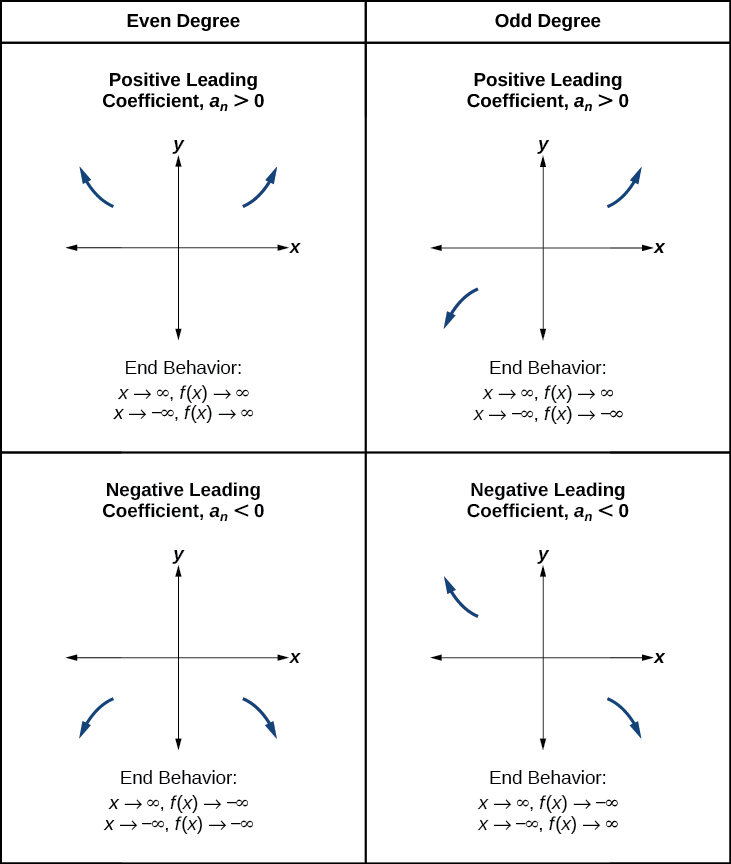
Recall that we call this behavior the end behavior of a function. As we pointed out when discussing quadratic equations, when the leading term of a polynomial function, a n x n , is an even power function, as x increases or decreases without bound, f ( x ) increases without bound. When the leading term is an odd power function, as x decreases without bound, f ( x ) also decreases without bound; as x increases without bound, f ( x ) also increases without bound. If the leading term is negative, it will change the direction of the end behavior. [link] summarizes all four cases.

Graph of a polynomial function with degree 5.

Understanding the relationship between degree and turning points

In addition to the end behavior, recall that we can analyze a polynomial function’s local behavior. It may have a turning point where the graph changes from increasing to decreasing (rising to falling) or decreasing to increasing (falling to rising). Look at the graph of the polynomial function f ( x ) = x 4 x 3 4 x 2 + 4 x in [link] . The graph has three turning points.
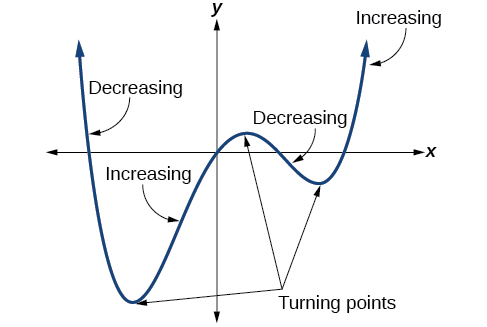
Graph of an odd-degree polynomial with a negative leading coefficient. Note that as x goes to positive infinity, f(x) goes to negative infinity, and as x goes to negative infinity, f(x) goes to positive infinity.

This function f is a 4 th degree polynomial function and has 3 turning points. The maximum number of turning points of a polynomial function is always one less than the degree of the function.

Interpreting turning points

A turning point    is a point of the graph where the graph changes from increasing to decreasing (rising to falling) or decreasing to increasing (falling to rising).

A polynomial of degree n will have at most n 1 turning points.

Finding the maximum number of turning points using the degree of a polynomial function

Find the maximum number of turning points of each polynomial function.

  1. f ( x ) = x 3 + 4 x 5 3 x 2 + 1
  2. f ( x ) = ( x 1 ) 2 ( 1 + 2 x 2 )
  1. First, rewrite the polynomial function in descending order: f ( x ) = 4 x 5 x 3 3 x 2 + 1

    Identify the degree of the polynomial function. This polynomial function is of degree 5.

    The maximum number of turning points is 5 1 = 4.

  2. First, identify the leading term of the polynomial function if the function were expanded.

    Graph of f(x)=x^4-x^3-4x^2+4x which denotes where the function increases and decreases and its turning points.

    Then, identify the degree of the polynomial function. This polynomial function is of degree 4.

    The maximum number of turning points is 4 1 = 3.

Got questions? Get instant answers now!

Graphing polynomial functions

We can use what we have learned about multiplicities, end behavior, and turning points to sketch graphs of polynomial functions. Let us put this all together and look at the steps required to graph polynomial functions.

Given a polynomial function, sketch the graph.

  1. Find the intercepts.
  2. Check for symmetry. If the function is an even function, its graph is symmetrical about the y - axis, that is, f ( x ) = f ( x ) . If a function is an odd function, its graph is symmetrical about the origin, that is, f ( x ) = f ( x ) .
  3. Use the multiplicities of the zeros to determine the behavior of the polynomial at the x - intercepts.
  4. Determine the end behavior by examining the leading term.
  5. Use the end behavior and the behavior at the intercepts to sketch a graph.
  6. Ensure that the number of turning points does not exceed one less than the degree of the polynomial.
  7. Optionally, use technology to check the graph.

Questions & Answers

Ayele, K., 2003. Introductory Economics, 3rd ed., Addis Ababa.
Widad Reply
can you send the book attached ?
Ariel
?
Ariel
What is economics
Widad Reply
the study of how humans make choices under conditions of scarcity
AI-Robot
U(x,y) = (x×y)1/2 find mu of x for y
Desalegn Reply
U(x,y) = (x×y)1/2 find mu of x for y
Desalegn
what is ecnomics
Jan Reply
this is the study of how the society manages it's scarce resources
Belonwu
what is macroeconomic
John Reply
macroeconomic is the branch of economics which studies actions, scale, activities and behaviour of the aggregate economy as a whole.
husaini
etc
husaini
difference between firm and industry
husaini Reply
what's the difference between a firm and an industry
Abdul
firm is the unit which transform inputs to output where as industry contain combination of firms with similar production 😅😅
Abdulraufu
Suppose the demand function that a firm faces shifted from Qd  120 3P to Qd  90  3P and the supply function has shifted from QS  20  2P to QS 10  2P . a) Find the effect of this change on price and quantity. b) Which of the changes in demand and supply is higher?
Toofiq Reply
explain standard reason why economic is a science
innocent Reply
factors influencing supply
Petrus Reply
what is economic.
Milan Reply
scares means__________________ends resources. unlimited
Jan
economics is a science that studies human behaviour as a relationship b/w ends and scares means which have alternative uses
Jan
calculate the profit maximizing for demand and supply
Zarshad Reply
Why qualify 28 supplies
Milan
what are explicit costs
Nomsa Reply
out-of-pocket costs for a firm, for example, payments for wages and salaries, rent, or materials
AI-Robot
concepts of supply in microeconomics
David Reply
economic overview notes
Amahle Reply
identify a demand and a supply curve
Salome Reply
i don't know
Parul
there's a difference
Aryan
Demand curve shows that how supply and others conditions affect on demand of a particular thing and what percent demand increase whith increase of supply of goods
Israr
Hi Sir please how do u calculate Cross elastic demand and income elastic demand?
Abari
Got questions? Join the online conversation and get instant answers!
Jobilize.com Reply
Practice Key Terms 4

Get Jobilize Job Search Mobile App in your pocket Now!

Get it on Google Play Download on the App Store Now


Source:  OpenStax, College algebra. OpenStax CNX. Feb 06, 2015 Download for free at https://legacy.cnx.org/content/col11759/1.3
Google Play and the Google Play logo are trademarks of Google Inc.

Notification Switch

Would you like to follow the 'College algebra' conversation and receive update notifications?

Ask