<< Chapter < Page Chapter >> Page >
In this section, you will:
  • Recognize characteristics of graphs of polynomial functions.
  • Use factoring to find zeros of polynomial functions.
  • Identify zeros and their multiplicities.
  • Determine end behavior.
  • Understand the relationship between degree and turning points.
  • Graph polynomial functions.
  • Use the Intermediate Value Theorem.

The revenue in millions of dollars for a fictional cable company from 2006 through 2013 is shown in [link] .

Year 2006 2007 2008 2009 2010 2011 2012 2013
Revenues 52.4 52.8 51.2 49.5 48.6 48.6 48.7 47.1

The revenue can be modeled by the polynomial function

R ( t ) = 0.037 t 4 + 1.414 t 3 19.777 t 2 + 118.696 t 205.332

where R represents the revenue in millions of dollars and t represents the year, with t = 6 corresponding to 2006. Over which intervals is the revenue for the company increasing? Over which intervals is the revenue for the company decreasing? These questions, along with many others, can be answered by examining the graph of the polynomial function. We have already explored the local behavior of quadratics, a special case of polynomials. In this section we will explore the local behavior of polynomials in general.

Recognizing characteristics of graphs of polynomial functions

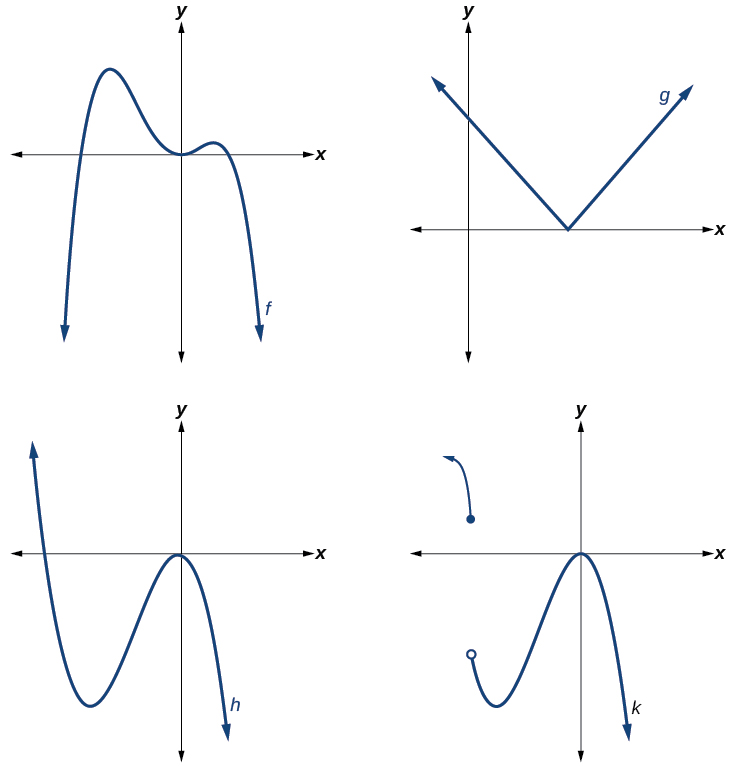
Polynomial functions of degree 2 or more have graphs that do not have sharp corners; recall that these types of graphs are called smooth curves. Polynomial functions also display graphs that have no breaks. Curves with no breaks are called continuous. [link] shows a graph that represents a polynomial function    and a graph that represents a function that is not a polynomial.
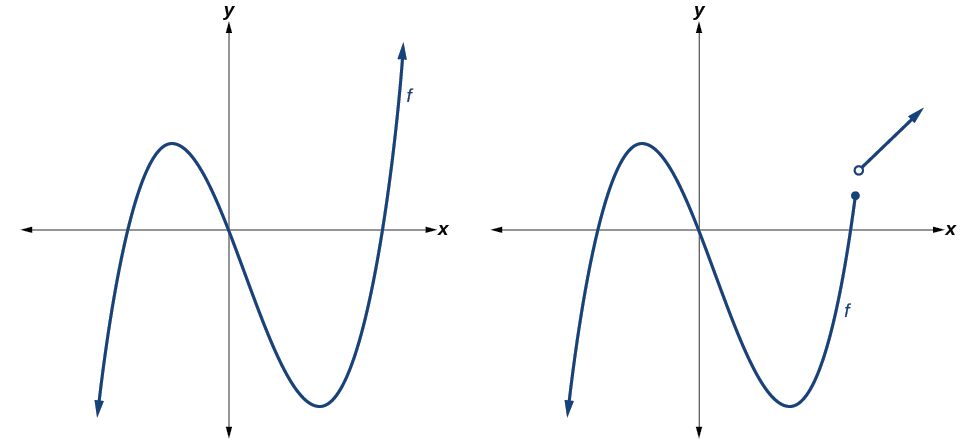
Graph of f(x)=x^3-0.01x.

Recognizing polynomial functions

Which of the graphs in [link] represents a polynomial function?

Two graphs in which one has a polynomial function and the other has a function closely resembling a polynomial but is not.

The graphs of f and h are graphs of polynomial functions. They are smooth and continuous .

The graphs of g and k are graphs of functions that are not polynomials. The graph of function g has a sharp corner. The graph of function k is not continuous.

Got questions? Get instant answers now!

Do all polynomial functions have as their domain all real numbers?

Yes. Any real number is a valid input for a polynomial function.

Using factoring to find zeros of polynomial functions

Recall that if f is a polynomial function, the values of x for which f ( x ) = 0 are called zeros    of f . If the equation of the polynomial function can be factored, we can set each factor equal to zero and solve for the zeros .

We can use this method to find x - intercepts because at the x - intercepts we find the input values when the output value is zero. For general polynomials, this can be a challenging prospect. While quadratics can be solved using the relatively simple quadratic formula, the corresponding formulas for cubic and fourth-degree polynomials are not simple enough to remember, and formulas do not exist for general higher-degree polynomials. Consequently, we will limit ourselves to three cases:

  1. The polynomial can be factored using known methods: greatest common factor and trinomial factoring.
  2. The polynomial is given in factored form.
  3. Technology is used to determine the intercepts.

Given a polynomial function f , find the x -intercepts by factoring.

  1. Set f ( x ) = 0.
  2. If the polynomial function is not given in factored form:
    1. Factor out any common monomial factors.
    2. Factor any factorable binomials or trinomials.
  3. Set each factor equal to zero and solve to find the x - intercepts.

Questions & Answers

how do you get the 2/50
Abba Reply
number of sport play by 50 student construct discrete data
Aminu Reply
width of the frangebany leaves on how to write a introduction
Theresa Reply
Solve the mean of variance
Veronica Reply
Step 1: Find the mean. To find the mean, add up all the scores, then divide them by the number of scores. ... Step 2: Find each score's deviation from the mean. ... Step 3: Square each deviation from the mean. ... Step 4: Find the sum of squares. ... Step 5: Divide the sum of squares by n – 1 or N.
kenneth
what is error
Yakuba Reply
Is mistake done to something
Vutshila
Hy
anas
hy
What is the life teble
anas
hy
Jibrin
statistics is the analyzing of data
Tajudeen Reply
what is statics?
Zelalem Reply
how do you calculate mean
Gloria Reply
diveving the sum if all values
Shaynaynay
let A1,A2 and A3 events be independent,show that (A1)^c, (A2)^c and (A3)^c are independent?
Fisaye Reply
what is statistics
Akhisani Reply
data collected all over the world
Shaynaynay
construct a less than and more than table
Imad Reply
The sample of 16 students is taken. The average age in the sample was 22 years with astandard deviation of 6 years. Construct a 95% confidence interval for the age of the population.
Aschalew Reply
Bhartdarshan' is an internet-based travel agency wherein customer can see videos of the cities they plant to visit. The number of hits daily is a normally distributed random variable with a mean of 10,000 and a standard deviation of 2,400 a. what is the probability of getting more than 12,000 hits? b. what is the probability of getting fewer than 9,000 hits?
Akshay Reply
Bhartdarshan'is an internet-based travel agency wherein customer can see videos of the cities they plan to visit. The number of hits daily is a normally distributed random variable with a mean of 10,000 and a standard deviation of 2,400. a. What is the probability of getting more than 12,000 hits
Akshay
1
Bright
Sorry i want to learn more about this question
Bright
Someone help
Bright
a= 0.20233 b=0.3384
Sufiyan
a
Shaynaynay
How do I interpret level of significance?
Mohd Reply
It depends on your business problem or in Machine Learning you could use ROC- AUC cruve to decide the threshold value
Shivam
how skewness and kurtosis are used in statistics
Owen Reply
yes what is it
Taneeya
Got questions? Join the online conversation and get instant answers!
Jobilize.com Reply
Practice Key Terms 4

Get Jobilize Job Search Mobile App in your pocket Now!

Get it on Google Play Download on the App Store Now


Source:  OpenStax, Algebra and trigonometry. OpenStax CNX. Nov 14, 2016 Download for free at https://legacy.cnx.org/content/col11758/1.6
Google Play and the Google Play logo are trademarks of Google Inc.

Notification Switch

Would you like to follow the 'Algebra and trigonometry' conversation and receive update notifications?

Ask