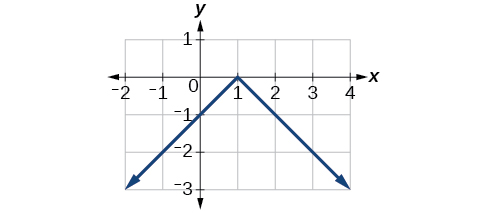
Reflect the graph of
(a) vertically and (b) horizontally.
Reflecting the graph vertically means that each output value will be reflected over the horizontal
t- axis as shown in
[link] .
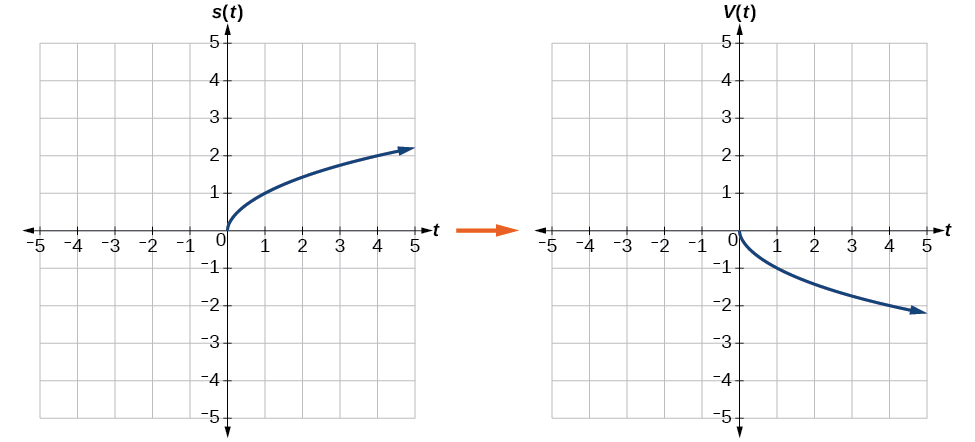
Vertical reflection of the square root function
Because each output value is the opposite of the original output value, we can write
Notice that this is an outside change, or vertical shift, that affects the output
values, so the negative sign belongs outside of the function.
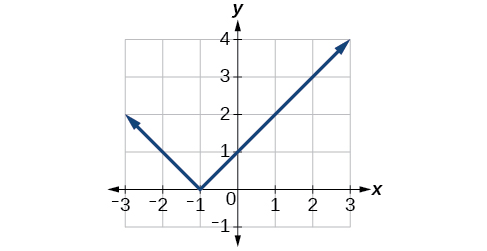
Reflecting horizontally means that each input value will be reflected over the vertical axis as shown in
[link] .
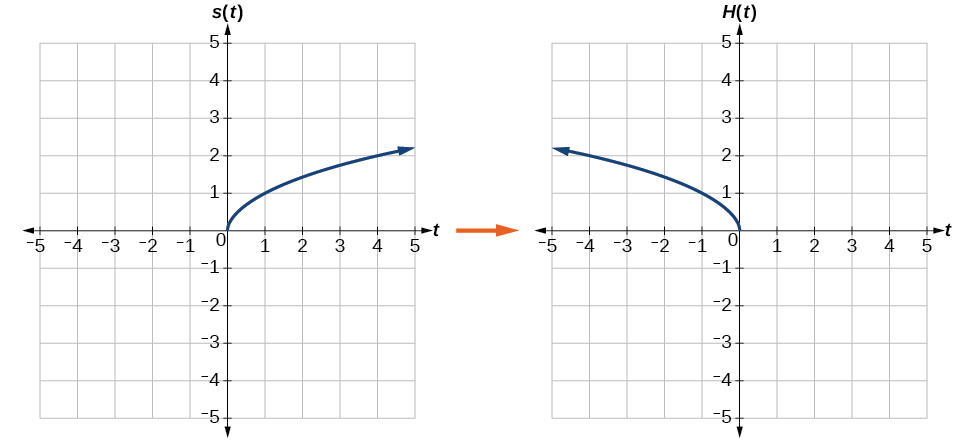
Horizontal reflection of the square root function
Because each input value is the opposite of the original input value, we can write
Notice that this is an inside change or horizontal change that affects the input values, so the negative sign is on the inside of the function.
Note that these transformations can affect the domain and range of the functions. While the original square root function has domain
and range
the vertical reflection gives the
function the range
and the horizontal reflection gives the
function the domain
Reflecting a tabular function horizontally and vertically
A function
is given as
[link] . Create a table for the functions below.
2
4
6
8
1
3
7
11
For
the negative sign outside the function indicates a vertical reflection, so the
x -values stay the same and each output value will be the opposite of the original output value. See
[link] .
2
4
6
8
–1
–3
–7
–11
For
the negative sign inside the function indicates a horizontal reflection, so each input value will be the opposite of the original input value and the
values stay the same as the
values. See
[link] .
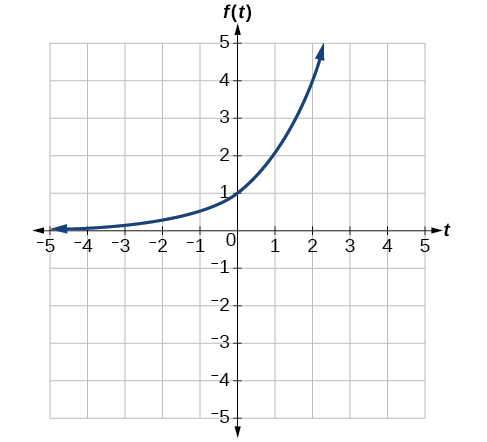
A common model for learning has an equation similar to
where
is the percentage of mastery that can be achieved after
practice sessions. This is a transformation of the function
shown in
[link] . Sketch a graph of
This equation combines three transformations into one equation.
A horizontal reflection:
A vertical reflection:
A vertical shift:
We can sketch a graph by applying these transformations one at a time to the original function. Let us follow two points through each of the three transformations. We will choose the points (0, 1) and (1, 2).
First, we apply a horizontal reflection: (0, 1) (–1, 2).
Then, we apply a vertical reflection: (0, -1) (-1, –2)
Finally, we apply a vertical shift: (0, 0) (-1, -1)).
This means that the original points, (0,1) and (1,2) become (0,0) and (-1,-1) after we apply the transformations.
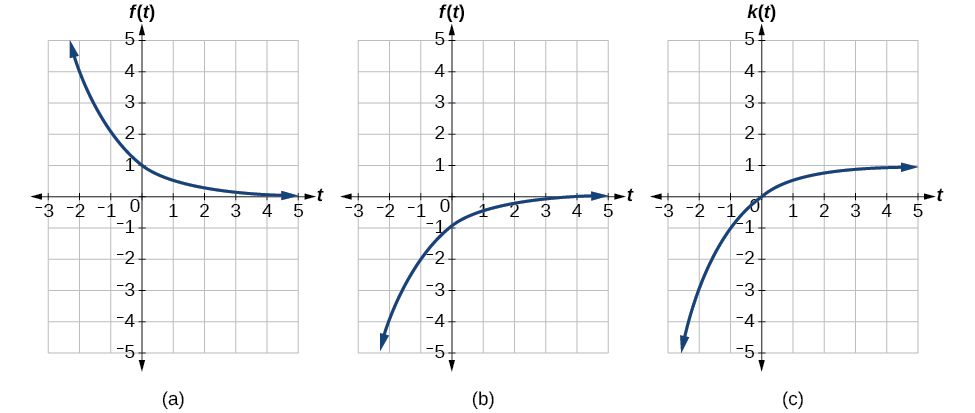
In
[link] , the first graph results from a horizontal reflection. The second results from a vertical reflection. The third results from a vertical shift up 1 unit.
Bacteria doesn't produce energy they are dependent upon their substrate in case of lack of nutrients they are able to make spores which helps them to sustain in harsh environments
_Adnan
But not all bacteria make spores, l mean Eukaryotic cells have Mitochondria which acts as powerhouse for them, since bacteria don't have it, what is the substitution for it?
Assimilatory nitrate reduction is a process that occurs in some microorganisms, such as bacteria and archaea, in which nitrate (NO3-) is reduced to nitrite (NO2-), and then further reduced to ammonia (NH3).
Elkana
This process is called assimilatory nitrate reduction because the nitrogen that is produced is incorporated in the cells of microorganisms where it can be used in the synthesis of amino acids and other nitrogen products
There are nothing like emergency disease but there are some common medical emergency which can occur simultaneously like Bleeding,heart attack,Breathing difficulties,severe pain heart stock.Hope you will get my point .Have a nice day ❣️
_Adnan
define infection ,prevention and control
Innocent
I think infection prevention and control is the avoidance of all things we do that gives out break of infections and promotion of health practices that promote life