<< Chapter < Page Chapter >> Page >
  • For the nanoparticles sample it is necessary to make sure the final concentration of the nanoparticles will not exceed 1 mM.
  • For the buffer solution, it is enough to dissolve 8 g of NaCl in DI water.
  • For the SDS solution, 2 g of SDS should be dissolved very slowly in approximate 200 mL of DI water, then 100 mL aliquots of DI water is added until the volume is 1 L. This is in order to avoid the formation of bubbles and foam in the solution.

Instrument preparation

Due to the sensitivity of the equipment, it is important to rinse and clean the tubing before loading any sample or performing any experiments. To rinse the tubing and the chambers, use a solution of 2% of SDS. For this purpose, a cycle in the autosampler equipment is program with the steps shown in [link] .

Summary of cleaning processes.
Step Duration (min) Speed (μL/min) Volume (mL)
DI water (1:2) 10 100 1
SDS (1:1) 20 300 6
DI water (1:2) 10 100 1

Once the equipment is cleaned, it is ready to perform an experiment, a second program in the autosampler is loaded with the parameters shown in [link] .

Experimental set-up.
Step Duration (min) Speed (μL/min) Volume (mL)
Buffer (1:3) 7 100 0.7
Nanoparticles (1:4) 30 100 3.0

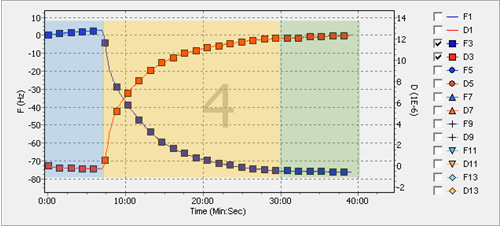
The purpose of flowing the buffer in the beginning is to provide a background signal to take into account when running the samples. Usually a small quantity of the sample is loaded into the sensor at a very slow flow rate in order to let the deposition take place.

Data acquisition

Example data obtained with the above parameters is shown in [link] . The blue squares depict the change in the frequency. As the experiment continues, the frequency decreases as more mass is deposited. On the other hand, shown as the red squares, the dissipation increases, describing the increase of both the height and certain loss of the rigidity in the layer from the top of the sensor. To illustrate the different steps of the experiment, each section has been color coded. The blue part of the data obtained corresponds to the flow of the buffer, while the yellow part corresponds to the deposition equilibrium of the nanoparticles onto the gold surface. After certain length of time equilibrium is reached and there is no further change. Once equilibrium indicates no change for about five minutes, it is safe to say the deposition will not change.

Data of deposition of nMag in a gold surface.

Instrument clean-up

As a measure preventive care for the equipment, the same cleaning procedure should be followed as what was done before loading the sample. Use of a 2% solution of SDS helps to ensure the equipment remains as clean as possible.

Data modeling

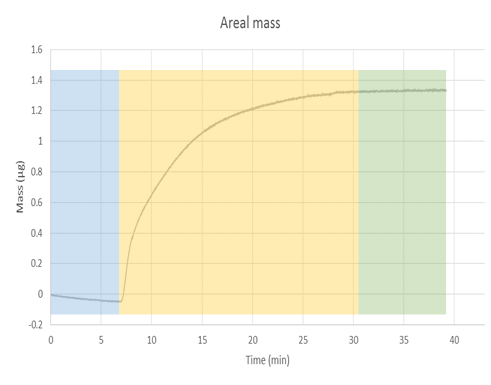
Once the data has been obtained, QTools (software that is available in the software suit of the equipment) can be used to convert the change in the frequency to areal mass, via the Sauerbrey equation, [link] . The correspondent graph of areal mass is shown in [link] . From this graph we can observe how the mass is increasing as the nMag is deposited in the surface of the sensor. The blue section again illustrates the part of the experiment where only buffer was been flown to the chamber. The yellow part illustrates the deposition, while the green part shows no change in the mass after a period of time, which indicates the deposition is finished. The conversion from areal mass to mass is a simple process, as gold sensors come with a definite area of 1 cm 2 , but a more accurate measure should be taken when using functionalized sensors.

Areal mass of deposition of nMag into gold surface.

It is important to take into account the limitations of the Saubery equation, because the equation accounts for a uniform layer on top of the surface of the sensor. Deviations due to clusters of material deposited in one place or the formation of partial multilayers in the sensor cannot be calculated through this model. Further characterization of the surface should be done to have a more accurate model of the phenomena.

Bibliography

  • Biolin Scientific, Cleaning and Immobilization Protocols (2004).
  • F. Hook, Development of a Novel QCM Technique for Protein Adsorption Studies , Chalmers University (1997).
  • C. Ziez, Theoretical and Experimental Analysis on Nanoparticle-Nanoparticle and Nanoparticle-Surface Interactions and their Role in Defining their Stability and Mobility , Rice University (2013).

Questions & Answers

A golfer on a fairway is 70 m away from the green, which sits below the level of the fairway by 20 m. If the golfer hits the ball at an angle of 40° with an initial speed of 20 m/s, how close to the green does she come?
Aislinn Reply
cm
tijani
what is titration
John Reply
what is physics
Siyaka Reply
A mouse of mass 200 g falls 100 m down a vertical mine shaft and lands at the bottom with a speed of 8.0 m/s. During its fall, how much work is done on the mouse by air resistance
Jude Reply
Can you compute that for me. Ty
Jude
what is the dimension formula of energy?
David Reply
what is viscosity?
David
what is inorganic
emma Reply
what is chemistry
Youesf Reply
what is inorganic
emma
Chemistry is a branch of science that deals with the study of matter,it composition,it structure and the changes it undergoes
Adjei
please, I'm a physics student and I need help in physics
Adjanou
chemistry could also be understood like the sexual attraction/repulsion of the male and female elements. the reaction varies depending on the energy differences of each given gender. + masculine -female.
Pedro
A ball is thrown straight up.it passes a 2.0m high window 7.50 m off the ground on it path up and takes 1.30 s to go past the window.what was the ball initial velocity
Krampah Reply
2. A sled plus passenger with total mass 50 kg is pulled 20 m across the snow (0.20) at constant velocity by a force directed 25° above the horizontal. Calculate (a) the work of the applied force, (b) the work of friction, and (c) the total work.
Sahid Reply
you have been hired as an espert witness in a court case involving an automobile accident. the accident involved car A of mass 1500kg which crashed into stationary car B of mass 1100kg. the driver of car A applied his brakes 15 m before he skidded and crashed into car B. after the collision, car A s
Samuel Reply
can someone explain to me, an ignorant high school student, why the trend of the graph doesn't follow the fact that the higher frequency a sound wave is, the more power it is, hence, making me think the phons output would follow this general trend?
Joseph Reply
Nevermind i just realied that the graph is the phons output for a person with normal hearing and not just the phons output of the sound waves power, I should read the entire thing next time
Joseph
Follow up question, does anyone know where I can find a graph that accuretly depicts the actual relative "power" output of sound over its frequency instead of just humans hearing
Joseph
"Generation of electrical energy from sound energy | IEEE Conference Publication | IEEE Xplore" ***ieeexplore.ieee.org/document/7150687?reload=true
Ryan
what's motion
Maurice Reply
what are the types of wave
Maurice
answer
Magreth
progressive wave
Magreth
hello friend how are you
Muhammad Reply
fine, how about you?
Mohammed
hi
Mujahid
A string is 3.00 m long with a mass of 5.00 g. The string is held taut with a tension of 500.00 N applied to the string. A pulse is sent down the string. How long does it take the pulse to travel the 3.00 m of the string?
yasuo Reply
Who can show me the full solution in this problem?
Reofrir Reply
Got questions? Join the online conversation and get instant answers!
Jobilize.com Reply

Get Jobilize Job Search Mobile App in your pocket Now!

Get it on Google Play Download on the App Store Now


Source:  OpenStax, Physical methods in chemistry and nano science. OpenStax CNX. May 05, 2015 Download for free at http://legacy.cnx.org/content/col10699/1.21
Google Play and the Google Play logo are trademarks of Google Inc.

Notification Switch

Would you like to follow the 'Physical methods in chemistry and nano science' conversation and receive update notifications?

Ask