This module shows how to compute the scaling function. It also has a section with a proof for an assumption made for the computation.
Given coefficients
that satisfy the regularity conditions, we can
iteratively calculate samples of
on a fine grid of points
using the
cascade algorithm . Once we
have obtained
, the wavelet scaling equation can be used to construct
.
In this discussion we assume that
is causal with impulse response length
. Recall, from our
discussion of the
regularity conditions , that this implies
will have compact support on the interval
. The cascade algorithm is described below.
Consider the scaling function at integer times
:
Knowing that
for
, the previous equation can be written using an
x
matrix. In the case where
, we have
The matrix
is
structured as a
row-decimated convolution
matrix . From the matrix equation above (
[link] ), we see that
must be (some scaled version of) the eigenvector
of
corresponding to eigenvalue
. In general, the nonzero values of
,
i.e. ,
, can be calculated by appropriately scaling the eigenvector
of the
x
row-decimated convolution matrix
corresponding to the
eigenvalue
. It can be shown that this eigenvector must be
scaled so that
.
Given
, we can use the scaling equation to determine
:
This produces the
non-zero samples
.
Given
, the scaling equation can be used to find
:
where
denotes the impulse response of
,
i.e. , a 2-upsampled version of
, and where
. Note that
is the result of convolving
with
.
Given
, another convolution yields
:
where
is a 4-upsampled version of
and where
.
At the
stage,
is calculated by convolving the result of the
stage with a
-upsampled version of
:
For
, this gives a very good approximation of
. At this point, you could verify the key properties of
, such as orthonormality and the satisfaction of the
scaling equation.
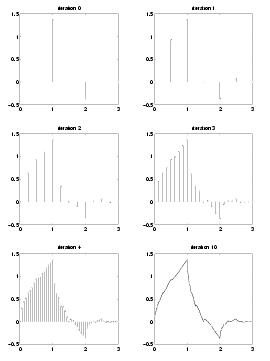
In
[link] we show steps 1 through 5
of the cascade algorithm, as well as step 10, using Daubechies'db2 coefficients (for which
).
In economics, a perfect market refers to a theoretical construct where all participants have perfect information, goods are homogenous, there are no barriers to entry or exit, and prices are determined solely by supply and demand. It's an idealized model used for analysis,
When MP₁ becomes negative, TP start to decline.
Extuples Suppose that the short-run production function of certain cut-flower firm is given by: Q=4KL-0.6K2 - 0.112 •
Where is quantity of cut flower produced, I is labour input and K is fixed capital input (K-5). Determine the average product of lab
Kelo
Extuples Suppose that the short-run production function of certain cut-flower firm is given by: Q=4KL-0.6K2 - 0.112 •
Where is quantity of cut flower produced, I is labour input and K is fixed capital input (K-5). Determine the average product of labour (APL) and marginal product of labour (MPL)
Quantity demanded refers to the specific amount of a good or service that consumers are willing and able to purchase at a give price and within a specific time period. Demand, on the other hand, is a broader concept that encompasses the entire relationship between price and quantity demanded
Ezea
ok
Shukri
how do you save a country economic situation when it's falling apart
Economic growth as an increase in the production and consumption of goods and services within an economy.but
Economic development as a broader concept that encompasses not only economic growth but also social & human well being.
Shukri
production function means
Jabir
What do you think is more important to focus on when considering inequality ?
sir...I just want to ask one question... Define the term contract curve? if you are free please help me to find this answer 🙏
Asui
it is a curve that we get after connecting the pareto optimal combinations of two consumers after their mutually beneficial trade offs
Awais
thank you so much 👍 sir
Asui
In economics, the contract curve refers to the set of points in an Edgeworth box diagram where both parties involved in a trade cannot be made better off without making one of them worse off. It represents the Pareto efficient allocations of goods between two individuals or entities, where neither p
Cornelius
In economics, the contract curve refers to the set of points in an Edgeworth box diagram where both parties involved in a trade cannot be made better off without making one of them worse off. It represents the Pareto efficient allocations of goods between two individuals or entities,
Cornelius
Suppose a consumer consuming two commodities X and Y has
The following utility function u=X0.4 Y0.6. If the price of the X and Y are 2 and 3 respectively and income Constraint is birr 50.
A,Calculate quantities of x and y which maximize utility.
B,Calculate value of Lagrange multiplier.
C,Calculate quantities of X and Y consumed with a given price.
D,alculate optimum level of output .