You have already been shown that when you have plotted a number of points (for instance from a table) on graph paper, the points may lie in a straight line, which you can draw.
But it is not always correct to join them with a line. Think back to the stepped graphs.
Sometimes the points will not lie in a straight line, but if they are joined they form, zig-zag line. This is often called a broken-line graph. But – is it always sensible to join the points?
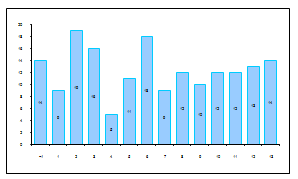
Below is a part of the frequency distribution of ages of siblings we had before.
Ages
<1
1
2
3
4
5
6
7
8
9
10
11
12
13
Total sisters
8
6
10
9
3
7
9
4
6
2
6
5
9
7
Total brothers
6
3
9
7
2
4
9
5
6
8
6
7
4
7
Total
14
9
19
16
5
11
18
9
12
10
12
12
13
14
2 Bar graphs
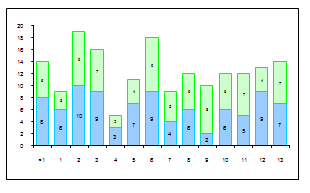
The next bar graph shows the girls and boys separately, but because the bars are stacked the top of the bar shows the total of boys and girls as well.
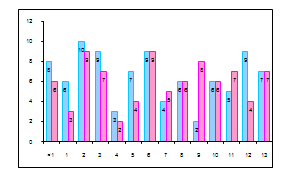
The same information can be drawn as bar graphs in a number of different ways; here is another one, with the bars next to each other, for you to study. Write a few sentences on the different bar graphs and how (in your own opinion) they represent the information most usefully.
3 Histograms
The publishers of a certain youth magazine wanted to find out how old their readers were. They asked the ages of everybody who bought the magazine at a stationery kiosk in a shopping mall. The categories shoppers could choose from, were:
Under 5
From 5 to 8, but not yet 8
8 years old
9 years old
More than 9 but less than 10 years and 6 months
More than 10½ years, but not yet 11
More than 11 years, but not yet 11½
More than 11½ years, but not yet 12
More than 12 years, but not yet 12½
More than 12½ years, but not yet 13
More than 13 years, but not yet 13½
More than 13½ years, but not yet 14
More than 14 years, but not yet 15
Between 15 and 16
Between 16 and 18
Between 18 and 20
Under 25
25 to 60
This is the first part of the table completed from their data:
Age
0
5
8
9
10
10,5
11
11,5
12
12,5
13
13,5
14
15
16
18
20
<5
<8
<9
<10
<10,5
<11
<11,5
<12
<12,5
<13
<13,5
<14
<15
<16
<18
<20
<25
Frequency
0
2
2
3
1
2
2
4
2
3
5
2
1
2
2
0
1
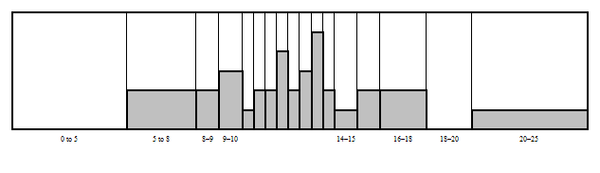
Below is the
histogram drawn from the data in the table. A histogram is very similar to a bar graph, but the bars are not separated, and the width of the bars depends on the size of the
intervals.
In the table we can see that the age intervals are not all the same; the first interval is five years, the next three years, etc. Fill in the missing horizontal axis labels yourself.
In the learner height data, all the intervals were 1 cm, which makes a bar graph a good and easy choice.
It is easy to make a mistake and draw a bar graph when you should be making a histogram because the intervals vary – be sure to check the interval lengths every time.
4 Pie charts
Pie charts have this name because they look like sliced pies!
Study the following examples.
The table shows the eating habits of learners attending a certain high school. They were asked to complete a small questionnaire, from which the data in the table was compiled.
Had no breakfast at home
Breakfasted at home
Brought breakfast to eat at school
Had lunch after going home
Brought lunch to school
Bought lunch from tuck shop
Brought e
x tra snacks to school
82
357
141
54
406
120
227
Questions & Answers
I'm interested in biological psychology and cognitive psychology
Communication is effective because it allows individuals to share ideas, thoughts, and information with others.
effective communication can lead to improved outcomes in various settings, including personal relationships, business environments, and educational settings. By communicating effectively, individuals can negotiate effectively, solve problems collaboratively, and work towards common goals.
it starts up serve and return practice/assessments.it helps find voice talking therapy also assessments through relaxed conversation.
miss
Every time someone flushes a toilet in the apartment building, the person begins to jumb back automatically after hearing the flush, before the water temperature changes. Identify the types of learning, if it is classical conditioning identify the NS, UCS, CS and CR. If it is operant conditioning, identify the type of consequence positive reinforcement, negative reinforcement or punishment
nature is an hereditary factor while nurture is an environmental factor which constitute an individual personality. so if an individual's parent has a deviant behavior and was also brought up in an deviant environment, observation of the behavior and the inborn trait we make the individual deviant.
Samuel
I am taking this course because I am hoping that I could somehow learn more about my chosen field of interest and due to the fact that being a PsyD really ignites my passion as an individual the more I hope to learn about developing and literally explore the complexity of my critical thinking skills