<< Chapter < Page Chapter >> Page >
Graph of 2 to the x. Shifted one to the left
y = 2 2 x size 12{y=2 cdot 2 rSup { size 8{x} } } {} aka y = 2 x + 1 size 12{y=2 rSup { size 8{x+1} } } {}

Once again, this is predictable from the rules of exponents: 2 2 x = 2 1 2 x = 2 x + 1 size 12{2 cdot 2 rSup { size 8{x} } =2 rSup { size 8{1} } cdot 2 rSup { size 8{x} } =2 rSup { size 8{x+1} } } {}

Using exponential functions to model behavior

In the first chapter, we talked about linear functions as functions that add the same amount every time . For instance, y = 3x + 4 size 12{y=3x+4} {} models a function that starts at 4; every time you increase x size 12{x} {} by 1, you add 3 to y size 12{y} {} .

Exponential functions are conceptually very analogous: they multiply by the same amount every time . For instance, y = 4 × 3 x size 12{y=4 times 3 rSup { size 8{x} } } {} models a function that starts at 4; every time you increase x size 12{x} {} by 1, you multiply y size 12{y} {} by 3.

Linear functions can go down, as well as up, by having negative slopes : y = 3x + 4 size 12{y= - 3x+4} {} starts at 4 and subtracts 3 every time. Exponential functions can go down, as well as up, by having fractional bases : y = 4 × ( 1 3 ) x size 12{y=4 times \( { {1} over {3} } \) rSup { size 8{x} } } {} starts at 4 and divides by 3 every time.

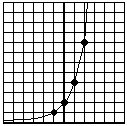
Exponential functions often defy intuition, because they grow much faster than people expect.

Modeling exponential functions

Your father’s house was worth $100,000 when he bought it in 1981. Assuming that it increases in value by 8 % size 12{8%} {} every year, what was the house worth in the year 2001? (*Before you work through the math, you may want to make an intuitive guess as to what you think the house is worth. Then, after we crunch the numbers, you can check to see how close you got.)

Often, the best way to approach this kind of problem is to begin by making a chart, to get a sense of the growth pattern.

Year Increase in Value Value
1981 N/A 100,000
1982 8 % size 12{8%} {} of 100,000 = 8,000 108,000
1983 8 % size 12{8%} {} of 108,000 = 8,640 116,640
1984 8 % size 12{8%} {} of 116,640 = 9,331 125,971

Before you go farther, make sure you understand where the numbers on that chart come from . It’s OK to use a calculator. But if you blindly follow the numbers without understanding the calculations, the whole rest of this section will be lost on you.

In order to find the pattern, look at the “Value” column and ask: what is happening to these numbers every time? Of course, we are adding 8 % size 12{8%} {} each time, but what does that really mean? With a little thought—or by looking at the numbers—you should be able to convince yourself that the numbers are multiplying by 1.08 each time . That’s why this is an exponential function: the value of the house multiplies by 1.08 every year.

So let’s make that chart again, in light of this new insight. Note that I can now skip the middle column and go straight to the answer we want. More importantly, note that I am not going to use my calculator this time—I don’t want to multiply all those 1.08s, I just want to note each time that the answer is 1.08 times the previous answer .

Year House Value
1981 100,000
1982 100 , 000 × 1 . 08 size 12{"100","000" times 1 "." "08"} {}
1983 100 , 000 × 1 . 08 2 size 12{"100","000" times 1 "." "08" rSup { size 8{2} } } {}
1984 100 , 000 × 1 . 08 3 size 12{"100","000" times 1 "." "08" rSup { size 8{3} } } {}
1985 100 , 000 × 1 . 08 4 size 12{"100","000" times 1 "." "08" rSup { size 8{4} } } {}
y size 12{y} {} 100 , 000 × 1 . 08 something size 12{"100","000" times 1 "." "08" rSup { size 8{"something"} } } {}

If you are not clear where those numbers came from, think again about the conclusion we reached earlier: each year, the value multiplies by 1.08. So if the house is worth 100 , 000 × 1 . 08 2 size 12{"100","000" times 1 "." "08" rSup { size 8{2} } } {} in 1983, then its value in 1984 is 100 , 000 × 1 . 08 2 × 1 . 08 size 12{ left ("100","000" times 1 "." "08" rSup { size 8{2} } right ) times 1 "." "08"} {} , which is 100 , 000 × 1 . 08 3 size 12{"100","000" times 1 "." "08" rSup { size 8{3} } } {} .

Once we write it this way, the pattern is clear. I have expressed that pattern by adding the last row, the value of the house in any year y size 12{y} {} . And what is the mystery exponent? We see that the exponent is 1 in 1982, 2 in 1983, 3 in 1984, and so on. In the year y size 12{y} {} , the exponent is y 1981 size 12{y - "1981"} {} .

So we have our house value function:

v ( y ) = 100 , 000 × 1 . 08 y 1981 size 12{v \( y \) ="100","000" times 1 "." "08" rSup { size 8{y - "1981"} } } {}

That is the pattern we needed in order to answer the question. So in the year 2001, the value of the house is 100 , 000 × 1 . 08 20 size 12{"100","000" times 1 "." "08" rSup { size 8{"20"} } } {} . Bringing the calculator back, we find that the value of the house is now $466,095 and change.

Wow! The house is over four times its original value! That’s what I mean about exponential functions growing faster than you expect: they start out slow, but given time, they explode. This is also a practical life lesson about the importance of saving money early in life—a lesson that many people don’t realize until it’s too late.

Questions & Answers

What is inflation
Bright Reply
a general and ongoing rise in the level of prices in an economy
AI-Robot
What are the factors that affect demand for a commodity
Florence Reply
price
Kenu
differentiate between demand and supply giving examples
Lambiv Reply
differentiated between demand and supply using examples
Lambiv
what is labour ?
Lambiv
how will I do?
Venny Reply
how is the graph works?I don't fully understand
Rezat Reply
information
Eliyee
devaluation
Eliyee
t
WARKISA
hi guys good evening to all
Lambiv
multiple choice question
Aster Reply
appreciation
Eliyee
explain perfect market
Lindiwe Reply
In economics, a perfect market refers to a theoretical construct where all participants have perfect information, goods are homogenous, there are no barriers to entry or exit, and prices are determined solely by supply and demand. It's an idealized model used for analysis,
Ezea
What is ceteris paribus?
Shukri Reply
other things being equal
AI-Robot
When MP₁ becomes negative, TP start to decline. Extuples Suppose that the short-run production function of certain cut-flower firm is given by: Q=4KL-0.6K2 - 0.112 • Where is quantity of cut flower produced, I is labour input and K is fixed capital input (K-5). Determine the average product of lab
Kelo
Extuples Suppose that the short-run production function of certain cut-flower firm is given by: Q=4KL-0.6K2 - 0.112 • Where is quantity of cut flower produced, I is labour input and K is fixed capital input (K-5). Determine the average product of labour (APL) and marginal product of labour (MPL)
Kelo
yes,thank you
Shukri
Can I ask you other question?
Shukri
what is monopoly mean?
Habtamu Reply
What is different between quantity demand and demand?
Shukri Reply
Quantity demanded refers to the specific amount of a good or service that consumers are willing and able to purchase at a give price and within a specific time period. Demand, on the other hand, is a broader concept that encompasses the entire relationship between price and quantity demanded
Ezea
ok
Shukri
how do you save a country economic situation when it's falling apart
Lilia Reply
what is the difference between economic growth and development
Fiker Reply
Economic growth as an increase in the production and consumption of goods and services within an economy.but Economic development as a broader concept that encompasses not only economic growth but also social & human well being.
Shukri
production function means
Jabir
What do you think is more important to focus on when considering inequality ?
Abdisa Reply
any question about economics?
Awais Reply
sir...I just want to ask one question... Define the term contract curve? if you are free please help me to find this answer 🙏
Asui
it is a curve that we get after connecting the pareto optimal combinations of two consumers after their mutually beneficial trade offs
Awais
thank you so much 👍 sir
Asui
In economics, the contract curve refers to the set of points in an Edgeworth box diagram where both parties involved in a trade cannot be made better off without making one of them worse off. It represents the Pareto efficient allocations of goods between two individuals or entities, where neither p
Cornelius
In economics, the contract curve refers to the set of points in an Edgeworth box diagram where both parties involved in a trade cannot be made better off without making one of them worse off. It represents the Pareto efficient allocations of goods between two individuals or entities,
Cornelius
Suppose a consumer consuming two commodities X and Y has The following utility function u=X0.4 Y0.6. If the price of the X and Y are 2 and 3 respectively and income Constraint is birr 50. A,Calculate quantities of x and y which maximize utility. B,Calculate value of Lagrange multiplier. C,Calculate quantities of X and Y consumed with a given price. D,alculate optimum level of output .
Feyisa Reply
Answer
Feyisa
c
Jabir
Got questions? Join the online conversation and get instant answers!
Jobilize.com Reply

Get Jobilize Job Search Mobile App in your pocket Now!

Get it on Google Play Download on the App Store Now


Source:  OpenStax, Math 1508 (lecture) readings in precalculus. OpenStax CNX. Aug 24, 2011 Download for free at http://cnx.org/content/col11354/1.1
Google Play and the Google Play logo are trademarks of Google Inc.

Notification Switch

Would you like to follow the 'Math 1508 (lecture) readings in precalculus' conversation and receive update notifications?

Ask