

| << Chapter < Page | Chapter >> Page > |
| Mean | =average(beginning cell address:end Cell address) |
|---|---|
| Median | =meadian(beginning cell address:end Cell address) |
| Mode* | =mode(beginning cell address:end Cell address) |
| Largest number | =large((beginning cell address:end Cell address,1) |
| Smallest number | =small(beginning cell address:end Cell address,1) |
| Range | =largest number-smallest number |
| Standard deviation | =stdev(beginning cell address:end Cell address) |
| 1 st quartile | =quartile(beginning cell address:end Cell address,1) |
| 2 nd quartile | =quartile(beginning cell address:end Cell address,2) |
| 3 rd quartile | =quartile(beginning cell address:end Cell address,3) |
| IQR | =3 rd quartile=1 st quartile |
| Percentile (eg. 90 th percentile) | =percentile(beginning cell address:end Cell address,the percentile between 0-1)Eg =percentile(beginning cell address:end Cell address, .9) |
| Z score | =(x – mean)/standard deviation |
These few formula will allow you to calculate the 5 number summary or the relevant data for normal or nearly normal data.
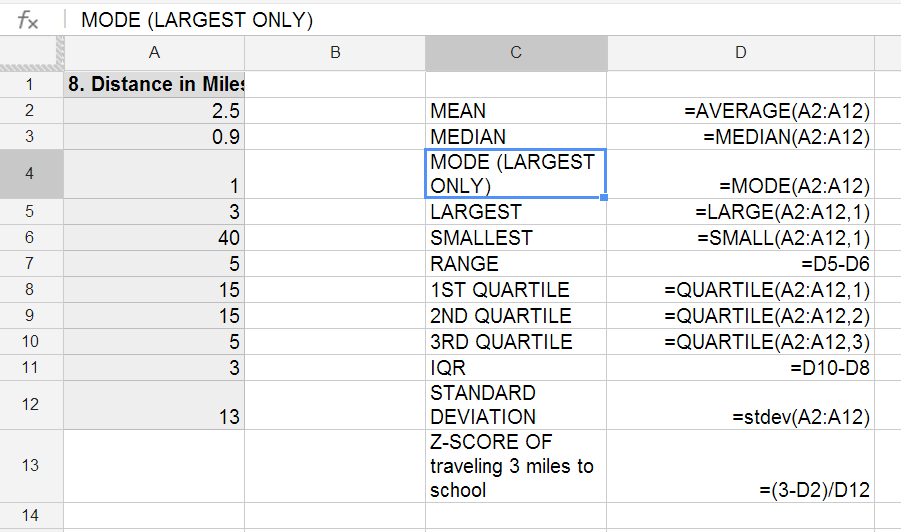
To use the above formulas to create summary statistics you will use one column for your labels and one column for placing your equations. Below are screenshots of how to create your descriptive statistics. The Googlespreadsheet document shows the equations. The excel document show the results of those equations.
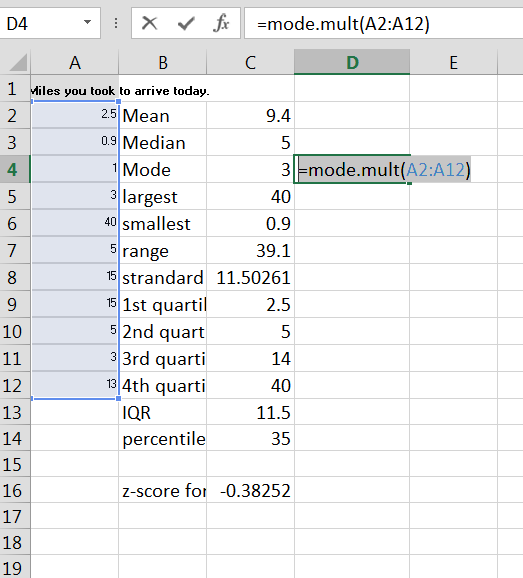
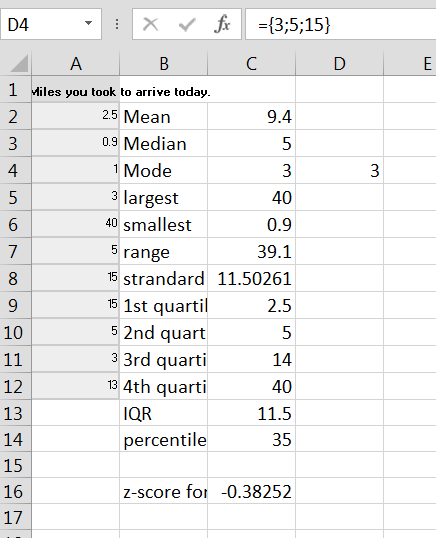
*Multiple Modes: In Google Spreadsheet the mode function will not provide multiple modes. In Google Spreadsheet only the mode of the one number (the largest number, see example below) will be provided if there are multiple modes. In Excel you also only see one number based on its “rank” in your list unless you highlight the cell with your MODE.MULT formula (as demonstrated below) and press F9 on your keyboard. You will then see your multiple modes. Note that once you left that cell, the only way you will see your multiple modes is in the formula bar as the screenshot indicates. View the screen shot below. The first screenshot is with the multiple mode formula highlighted. The second screenshot is after pressing F9. on the keyboard. The third screenshot displays the formulas for a set of data in Google Spreadsheet.
To use the above formulas to create summary statistics you will use one column for your labels and one column for placing your equations. Below is a screenshot of one example of how to create your descriptive statistics. The Googlespreadsheet document shows the equations. The excel document show the results of those equations.
At your computer, try this exercise: (1) Open the file, Statistics First Day of Class Survey that you worked on previously (2) open the file in Excel or Google Spreadsheet (3) create a new worksheet tab and label it Descriptive Statistics; (4) pick column of data that is quantitative and has been “cleaned” and create a the descriptive statistics with appropriate titles, labels, and lines; (4) Based on your descriptive statistics, determine if you will create a historgram or a box plot of the data (5) create the appropriate graph (6) compy your descriptive statistics and your graph into a word document and describe the data and tell the story about the shape, center, spread of your data. (7) save the Excel or Google Spreadsheet file again and this time post only the word document you created in the appropriate Moodle assignment.
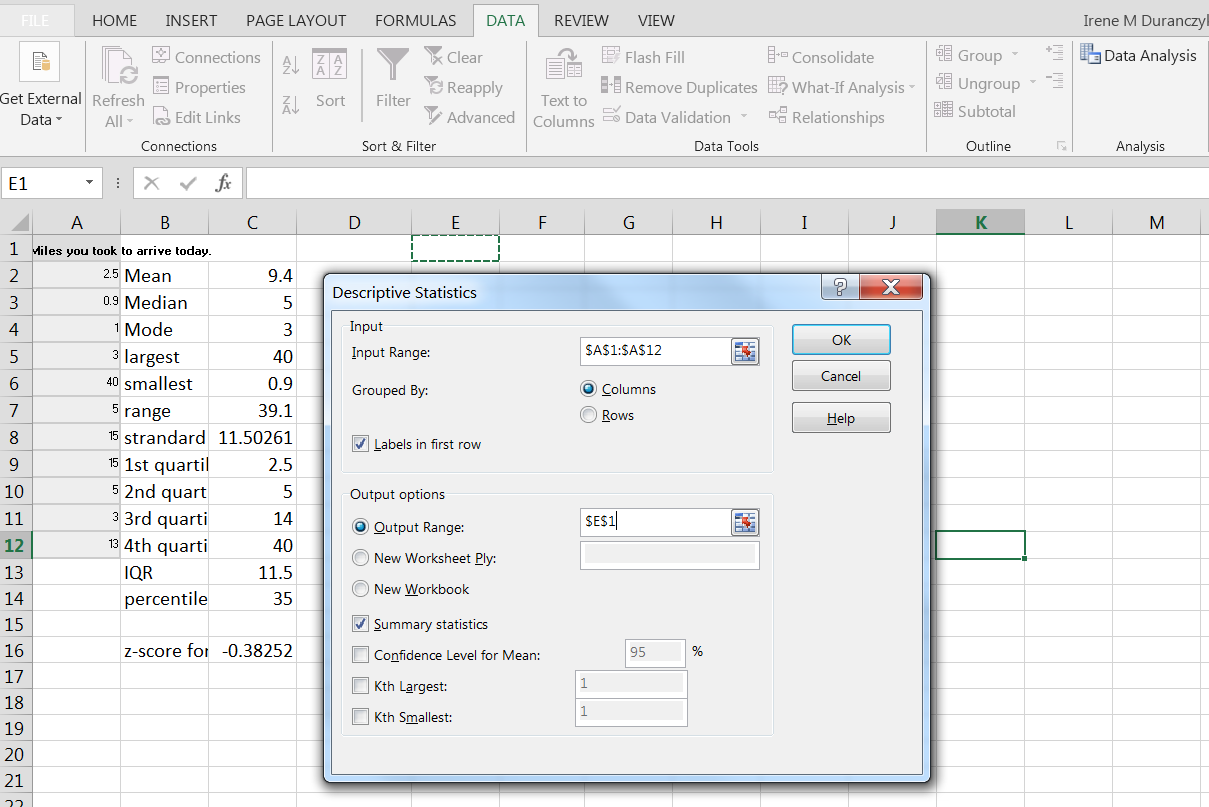
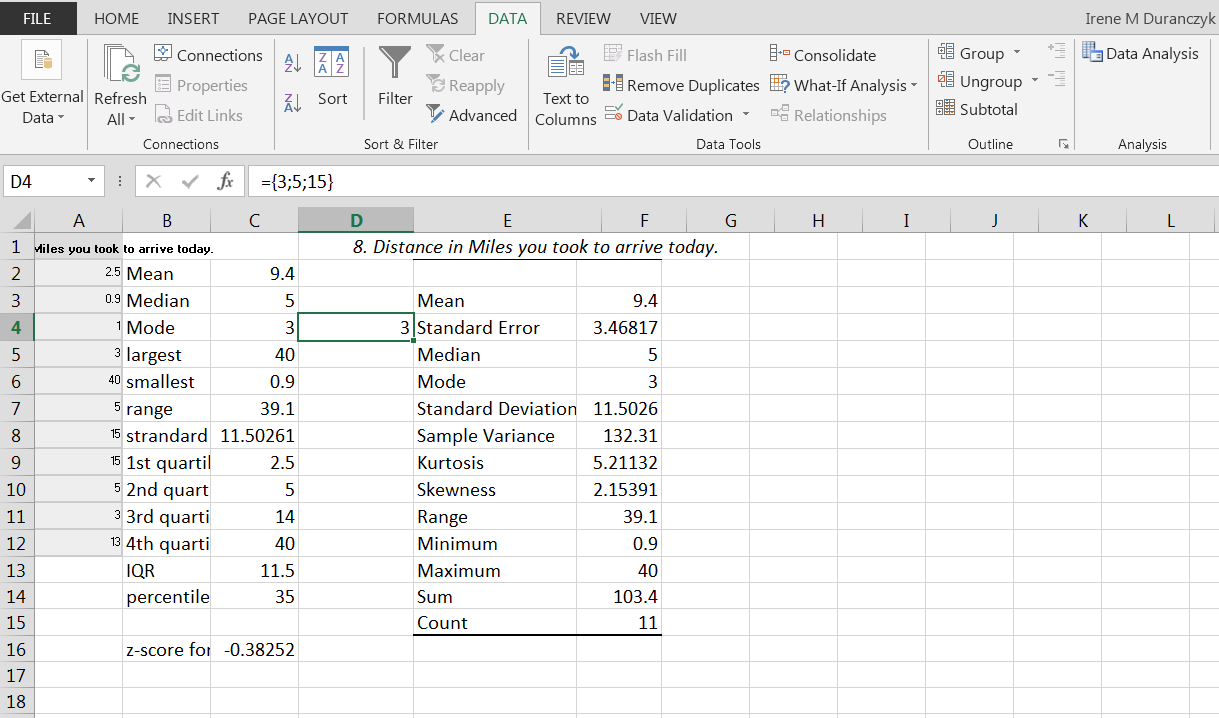
When one is using Excel and one only has quantitative data, there is another option to create a chart of the descriptive statistics. On the Excel Ribbon, if you choose the “DATA” tab, you will see Data Analysis as one of the menu items. If you double click on “data analysis”, a popup menu will appear. The options are in alphabetical order and you will be looking for Descriptive statistics. If you click once on descriptive statistics to highlight it, and mouse over and click on the “OK” button, another popup menu will appear. Here you will enter your input range which is the beginning and end cell address for your data including your label in the first row, put a check mark in the “Labels in the First Row” box, and a check mark in the “Summary statistics” box. You have one more choice left. Do you what you descriptive statistics on the same spreadsheet that you are working on or do you want to put the descriptive statistics on a separate worksheet. If you want the descriptive statistics on a separate worksheet click on the radial button in front of New Worksheet. If you want the descriptive statistics chart in the same worksheet click on the radial button in from of “Output Range” and then you will need to put in an empty cell address in the box provided by entering it or placing your curser in the box provided and then clicking on a single empty cell on your spreadsheet. Next, click on the “OK” button. Voila, descriptive statistics will appear. See images below. Once again without using =MODE.MULT the descriptive statistics only gives one of the modes from this data set.
Notification Switch
Would you like to follow the 'Collaborative statistics using spreadsheets' conversation and receive update notifications?

|
|

|
|

|
|

|
|

|
|

|
|

|
|

|
|

|
|

|