

| << Chapter < Page | Chapter >> Page > |
The observed values are what you observed from your data, they are the numbers in the two-way table. The expected values are the ones you calculated for the expected cell frequency condition. For this test statistics build a fraction, observed minus expected squared divided by the expected, for each cell in the two-way table. These fractions will be connected with addition; the capital sigma is mathematics language for sum or add the values together.
The item we need before turning to the chi-table and determining the p-value is the degrees of freedom. The degrees of freedom are based on how large the two-way table is;
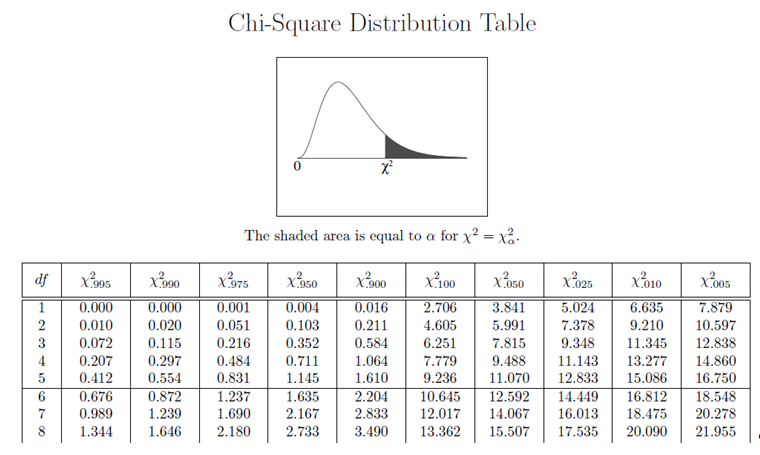
To find the p-value and determine if you will reject or fail to reject the null hypothesis you will need the chi-table, the test statistic you calculated, and the degrees of freedom. To find the p-value locate the degrees of freedom along the side of the table. Then look in that row for the test statistic you calculated. It will either be smaller than the first on listed, in between two critical values on the table or larger than the last one list on the table for your degrees of freedom. Once you find where your value falls follow the column(s) to the top of the page to determine the range where your p-value is located.
Consider the following example.
Suppose = a speeding violation in the last year and = a cell phone user while driving. If and are independent then . is the event that a driver received a speeding violation last year and is also a cell phone user while driving.Suppose, in a study of drivers who received speeding violations in the last year and who uses cell phones while driving, that 755 people were surveyed. Out of the 755, 70 had a speedingviolation and 685 did not; 305 were cell phone users while driving and 450 were not.
Let = expected number of drivers that use a cell phone while driving and received speeding violations.
If and are independent, then . By substitution,
Solve for
About 28 people from the sample are expected to be cell phone users while driving and to receive speeding violations.
In a test of independence, we state the null and alternate hypotheses in words. Since the contingency table consists of two factors , the null hypothesis states that the factors are independent and the alternate hypothesis states that they are not independent (dependent) . If we do a test of independence using the example above, then the null hypothesis is:
: Being a cell phone user while driving and receiving a speeding violation are independent events.
If the null hypothesis were true, we would expect about 28 people to be cell phone users while driving and to receive a speeding violation.
The test of independence is always right-tailed because of the calculation of the test statistic. If the expected and observed values are not close together, then the teststatistic is very large and way out in the right tail of the chi-square curve, like goodness-of-fit.
The degrees of freedom for the test of independence are:
The following formula calculates the expected number ( ):
Notification Switch
Would you like to follow the 'Collaborative statistics using spreadsheets' conversation and receive update notifications?

|
|

|
|

|
|

|
|

|
|

|
|

|
|

|
|

|
|

|