Functions of the form
y
=
a
b
(
x
)
+
q are known as
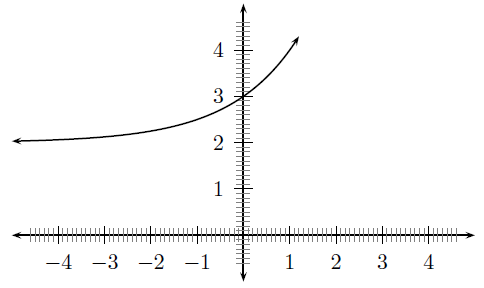
exponential functions. The general shape of a graph of a function of this form is shown in
[link] .
General shape and position of the graph of a function of the form
f
(
x
)
=
a
b
(
x
)
+
q .
On the same set of axes, plot the following graphs:
a
(
x
)
=
-
2
·
b
(
x
)
+
1
b
(
x
)
=
-
1
·
b
(
x
)
+
1
c
(
x
)
=
0
·
b
(
x
)
+
1
d
(
x
)
=
1
·
b
(
x
)
+
1
e
(
x
)
=
2
·
b
(
x
)
+
1 Use your results to deduce the effect of
a .
On the same set of axes, plot the following graphs:
f
(
x
)
=
1
·
b
(
x
)
-
2
g
(
x
)
=
1
·
b
(
x
)
-
1
h
(
x
)
=
1
·
b
(
x
)
+
0
j
(
x
)
=
1
·
b
(
x
)
+
1
k
(
x
)
=
1
·
b
(
x
)
+
2 Use your results to deduce the effect of
q .
You should have found that the value of
a affects whether the graph curves upwards (
a
>
0 ) or curves downwards (
a
<
0 ).
You should have also found that the value of
q affects the position of the
y -intercept.
These different properties are summarised in
[link] .
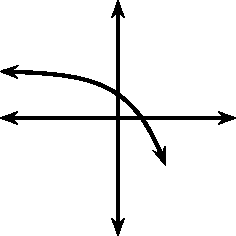
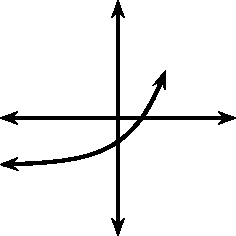
a
>
0
a
<
0
q
>
0
q
<
0
Table summarising general shapes and positions of functions of the form
y
=
a
b
(
x
)
+
q .
Domain and range
For
y
=
a
b
(
x
)
+
q , the function is defined for all real values of
x . Therefore, the domain is
{
x
:
x
∈
R
} .
The range of
y
=
a
b
(
x
)
+
q is dependent on the sign of
a .
If
a
>
0 then:
b
(
x
)
≥
0
a
·
b
(
x
)
≥
0
a
·
b
(
x
)
+
q
≥
q
f
(
x
)
≥
q
Therefore, if
a
>
0 , then the range is
{
f
(
x
)
:
f
(
x
)
∈
[
q
;
∞
)
} .
If
a
<
0 then:
b
(
x
)
≤
0
a
·
b
(
x
)
≤
0
a
·
b
(
x
)
+
q
≤
q
f
(
x
)
≤
q
Therefore, if
a
<
0 , then the range is
{
f
(
x
)
:
f
(
x
)
∈
(
-
∞
;
q
]
} .
For example, the domain of
g
(
x
)
=
3
·
2
x
+
2 is
{
x
:
x
∈
R
} .
For the range,
2
x
≥
0
3
·
2
x
≥
0
3
·
2
x
+
2
≥
2
Therefore the range is
{
g
(
x
)
:
g
(
x
)
∈
[
2
;
∞
)
} .
Intercepts
For functions of the form,
y
=
a
b
(
x
)
+
q , the intercepts with the
x and
y axis is calculated by setting
x
=
0 for the
y -intercept and by setting
y
=
0 for the
x -intercept.
The
y -intercept is calculated as follows:
y
=
a
b
(
x
)
+
q
y
i
n
t
=
a
b
(
0
)
+
q
=
a
(
1
)
+
q
=
a
+
q
For example, the
y -intercept of
g
(
x
)
=
3
·
2
x
+
2 is given by setting
x
=
0 to get:
y
=
3
·
2
x
+
2
y
i
n
t
=
3
·
2
0
+
2
=
3
+
2
=
5
The
x -intercepts are calculated by setting
y
=
0 as follows:
y
=
a
b
(
x
)
+
q
0
=
a
b
(
x
i
n
t
)
+
q
a
b
(
x
i
n
t
)
=
-
q
b
(
x
i
n
t
)
=
-
q
a
Which only has a real solution if either
a
<
0 or
q
<
0 . Otherwise, the graph of the function of form
y
=
a
b
(
x
)
+
q does not have any
x -intercepts.
For example, the
x -intercept of
g
(
x
)
=
3
·
2
x
+
2 is given by setting
y
=
0 to get:
y
=
3
·
2
x
+
2
0
=
3
·
2
x
i
n
t
+
2
-
2
=
3
·
2
x
i
n
t
2
x
i
n
t
=
-
2
3
which has no real solution. Therefore, the graph of
g
(
x
)
=
3
·
2
x
+
2 does not have any
x -intercepts.
Asymptotes
Functions of the form
y
=
a
b
(
x
)
+
q have a single horizontal asymptote. The asymptote can be determined by examining the range.
We have seen that the range is controlled by the value of q. If
a
>
0 , then the range is
{
f
(
x
)
:
f
(
x
)
∈
[
q
;
∞
)
} .And if
a
>
0 , then the range is
{
f
(
x
)
:
f
(
x
)
∈
[
q
;
∞
)
} .
This shows that the function tends towards the value of q as
x
∞ . Therefore the horizontal asymptote lies at
x
=
q .
In order to sketch graphs of functions of the form,
f
(
x
)
=
a
b
(
x
)
+
q , we need to determine four characteristics:
domain and range
asymptote
y -intercept
x -intercept
For example, sketch the graph of
g
(
x
)
=
3
·
2
x
+
2 . Mark the intercepts.
We have determined the domain to be
{
x
:
x
∈
R
} and the range to be
{
g
(
x
)
:
g
(
x
)
∈
[
2
,
∞
)
} .
The
y -intercept is
y
i
n
t
=
5 and there are no
x -intercepts.
Graph of
g
(
x
)
=
3
·
2
x
+
2 .
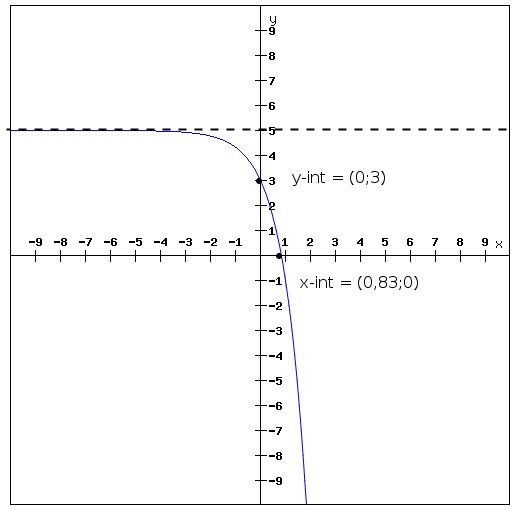
Draw the graph of
y
=
-
2
.
3
x
+
5 .
Find the domain and range The domain is:
{
x
:
x
∈
R
} and the range is:
{
f
(
x
)
:
f
(
x
)
∈
(
-
∞
;
5
]
} .
Calculate the asymptote There is one asymptote for functions of this form. This occurs at
y
=
q . So the asymptote for this graph is at
y
=
5
Calculate the y-intercept The y-intercept occurs when
x
=
0 .
y
=
-
2
.
3
x
+
5
y
=
-
2
.
3
0
+
5
y
=
-
2
(
1
)
+
5
y
int
=
7
So there is one y-intercept at
(
0
,
7
) .
Calculate the x-intercept The x-intercept occurs when
y
=
0 . Calculating the x-intercept gives:
y
=
-
2
.
3
x
+
5
0
=
-
2
.
3
x
+
5
-
5
=
-
2
.
3
x
3
x
int
=
5
2
x
int
=
0,83
So there is one x-intercept at
(
0,83
,
0
) .
Plot the graph Putting all this together gives us the following graph:
Got questions? Get instant answers now!