Notice in this definition that
x and
y are used in two ways. The first is as functions of the independent variable
t. As
t varies over the interval
I , the functions
and
generate a set of ordered pairs
This set of ordered pairs generates the graph of the parametric equations. In this second usage, to designate the ordered pairs,
x and
y are variables. It is important to distinguish the variables
x and
y from the functions
and
Graphing a parametrically defined curve
Sketch the curves described by the following parametric equations:
To create a graph of this curve, first set up a table of values. Since the independent variable in both
and
is
t , let
t appear in the first column. Then
and
will appear in the second and third columns of the table.
t
−3
−4
−2
−2
−3
0
−1
−2
2
0
−1
4
1
0
6
2
1
8
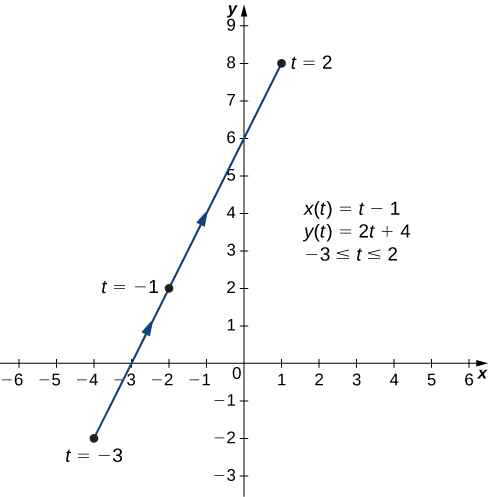
The second and third columns in this table provide a set of points to be plotted. The graph of these points appears in
[link] . The arrows on the graph indicate the
orientation of the graph, that is, the direction that a point moves on the graph as
t varies from −3 to 2.
Graph of the plane curve described by the parametric equations in part a.
To create a graph of this curve, again set up a table of values.
t
−2
1
−3
−1
−2
−1
0
−3
1
1
−2
3
2
1
5
3
6
7
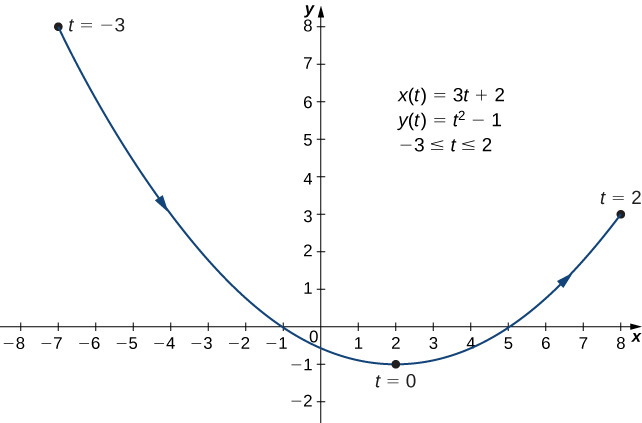
The second and third columns in this table give a set of points to be plotted (
[link] ). The first point on the graph (corresponding to
has coordinates
and the last point (corresponding to
has coordinates
As
t progresses from −2 to 3, the point on the curve travels along a parabola. The direction the point moves is again called the orientation and is indicated on the graph.
Graph of the plane curve described by the parametric equations in part b.
In this case, use multiples of
for
t and create another table of values:
t
t
0
4
0
2
−2
0
−4
0
4
2
−2
2
2
4
0
−4
0
The graph of this plane curve appears in the following graph.
Graph of the plane curve described by the parametric equations in part c. This is the graph of a circle with radius 4 centered at the origin, with a counterclockwise orientation. The starting point and ending points of the curve both have coordinates
To better understand the graph of a curve represented parametrically, it is useful to rewrite the two equations as a single equation relating the variables
x and
y. Then we can apply any previous knowledge of equations of curves in the plane to identify the curve. For example, the equations describing the plane curve in
[link] b. are
Solving the second equation for
t gives
This can be substituted into the first equation:
This equation describes
x as a function of
y. These steps give an example of
eliminating the parameter . The graph of this function is a parabola opening to the right. Recall that the plane curve started at
and ended at
These terminations were due to the restriction on the parameter
t.