-
Home
- Music appreciation
- Music appreciation
- Musical meter activities
Lesson plans for four activities that encourage students to hear meter and move to meter in music, and to relate heard meter to notated time signature.
Introduction
Children do not have to learn to read music in order to recognize meter. In fact, a child who is already comfortable with the concept (and feel) of meter may have less trouble learning to read music, follow a
conductor , and understand
written notes and
time signatures . For definitions and other information on meter, please see
Meter in Music . The activities below include
Listen for Meter ,
Sing with Meter ,
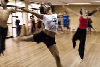
Dance with Meter , and
Recognize Meter in Time Signature
Goals and assessment
-
Goals - The student will recognize specific meters in aural examples of music, and will demonstrate meter actively by appropriate clapping, vocalization, and/or movement, or by identifying a likely time signature.
-
Music Standards Addressed -
National Standards for Music Education standard 6 (listening to, analyzing, and describing music), and (for
Recognize Meter in Time Signature only) 5 (reading and notating music).
-
Other Subjects Addressed - The activity also addresses
National Dance Standards standard 1 (identifying and demonstrating movement elements and skills in performing dance), 2 (understanding the choreographic principles, processes, and structures)
Listen for meter
Objectives and assessment
-
Grade Level - preK (if developmentally ready) - 12
-
Student Prerequisites - Students should be able to accurately identify and clap along with the beat of a piece of music.
-
Teacher Expertise - The teacher should be familiar and comfortable with the terms and concepts regarding
meter , and should be able to accurately and easily identify heard meter.
-
Time Requirements - If you have many different musical examples, and will also be exploring simple and compound meters, this activity may take one (approximately 45-minute) class period. It may also be done as a short (5-15-minute) warm-up to other music activities or as a break from desk work.
-
Objectives - Given an aural example of music, the student will clap to the beat, distinguish weak from strong beats, and clap only on strong beats. The student will identify the meter of the music by determining the number of weak beats for every strong beat.
-
Extensions - Advanced students may be asked to distinguish heard beat subdivisions by vocalizing with them, and to identify whether the meter is simple or compound. For students who are learning to read music, see
Recognize Meter in Time Signatures .
-
Evaluation - During the activity, assess whether each student can do the following independently (without waiting to imitate the teacher or other students), along with others, in direct imitation of others, or not at all: clap on the beat, clap only on the strong beats, count the number of weak beats for each strong beat, vocalize with the beat subdivisions, and name the meter. If students are not at the level you would like, repeat the activity occasionally throughout the year.
-
Follow-up - Help commit these lessons to long-term memory, by continuing throughout the year to ask students to identify the meter of music that they are hearing or learning.
Questions & Answers
a general and ongoing rise in the level of prices in an economy
AI-Robot
What are the factors that affect demand for a commodity
differentiate between demand and supply
giving examples
differentiated between demand and supply using examples
Lambiv
how is the graph works?I don't fully understand
hi guys good evening to all
Lambiv
In economics, a perfect market refers to a theoretical construct where all participants have perfect information, goods are homogenous, there are no barriers to entry or exit, and prices are determined solely by supply and demand. It's an idealized model used for analysis,
Ezea
other things being equal
AI-Robot
When MP₁ becomes negative, TP start to decline.
Extuples Suppose that the short-run production function of certain cut-flower firm is given by: Q=4KL-0.6K2 - 0.112 •
Where is quantity of cut flower produced, I is labour input and K is fixed capital input (K-5). Determine the average product of lab
Kelo
Extuples Suppose that the short-run production function of certain cut-flower firm is given by: Q=4KL-0.6K2 - 0.112 •
Where is quantity of cut flower produced, I is labour input and K is fixed capital input (K-5). Determine the average product of labour (APL) and marginal product of labour (MPL)
Kelo
Can I ask you other question?
Shukri
What is different between quantity demand and demand?
Quantity demanded refers to the specific amount of a good or service that consumers are willing and able to purchase at a give price and within a specific time period. Demand, on the other hand, is a broader concept that encompasses the entire relationship between price and quantity demanded
Ezea
how do you save a country economic situation when it's falling apart
what is the difference between economic growth and development
Economic growth as an increase in the production and consumption of goods and services within an economy.but
Economic development as a broader concept that encompasses not only economic growth but also social & human well being.
Shukri
production function means
Jabir
What do you think is more important to focus on when considering inequality ?
any question about economics?
sir...I just want to ask one question... Define the term contract curve? if you are free please help me to find this answer 🙏
Asui
it is a curve that we get after connecting the pareto optimal combinations of two consumers after their mutually beneficial trade offs
Awais
thank you so much 👍 sir
Asui
In economics, the contract curve refers to the set of points in an Edgeworth box diagram where both parties involved in a trade cannot be made better off without making one of them worse off. It represents the Pareto efficient allocations of goods between two individuals or entities, where neither p
Cornelius
In economics, the contract curve refers to the set of points in an Edgeworth box diagram where both parties involved in a trade cannot be made better off without making one of them worse off. It represents the Pareto efficient allocations of goods between two individuals or entities,
Cornelius
Suppose a consumer consuming two commodities X and Y has
The following utility function u=X0.4 Y0.6. If the price of the X and Y are 2 and 3 respectively and income Constraint is birr 50.
A,Calculate quantities of x and y which maximize utility.
B,Calculate value of Lagrange multiplier.
C,Calculate quantities of X and Y consumed with a given price.
D,alculate optimum level of output .
Got questions? Join the online conversation and get instant answers!
Source:
OpenStax, Music appreciation. OpenStax CNX. Mar 24, 2014 Download for free at http://cnx.org/content/col11640/1.1
Google Play and the Google Play logo are trademarks of Google Inc.