<< Chapter < Page Chapter >> Page >

Questions or comments concerning this laboratory should be directedto Prof. Charles A. Bouman, School of Electrical and Computer Engineering, Purdue University, West Lafayette IN 47907;(765) 494-0340; bouman@ecn.purdue.edu

Introduction

This is the first part of a two week experiment in image processing. During this week, we will cover the fundamentalsof digital monochrome images, intensity histograms, pointwise transformations, gamma correction, and image enhancement based on filtering.

In the second week, we will cover some fundamental concepts of colorimages. This will include a brief description on how humans perceive color, followed by descriptions of two standard color spaces.The second week will also discuss an application known as image halftoning .

Introduction to monochrome images

An image is the optical representation of objects illuminated by a light source. Since we want to process images using acomputer, we represent them as functions of discrete spatial variables. For monochrome (black-and-white) images, a scalar function f ( i , j ) can be used to represent the light intensity at each spatial coordinate ( i , j ) . [link] illustrates the convention we will use for spatial coordinates to represent images.

Spatial coordinates used in digital image representation.

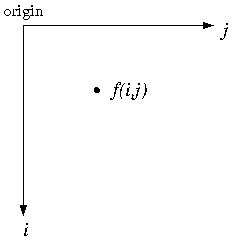
If we assume the coordinates to be a set of positive integers, for example i = 1 , , M and j = 1 , , N , then an image can be conveniently represented by a matrix.

f ( i , j ) = f ( 1 , 1 ) f ( 1 , 2 ) f ( 1 , N ) f ( 2 , 1 ) f ( 2 , 2 ) f ( 2 , N ) f ( M , 1 ) f ( M , 2 ) f ( M , N )

We call this an M × N image, and the elements of the matrix are known as pixels .

The pixels in digital images usually take on integer values in the finite range,

0 f ( i , j ) L m a x

where 0 represents the minimum intensity level (black), and L m a x is the maximum intensity level (white) that the digital image can take on. The interval [ 0 , L m a x ] is known as a gray scale .

In this lab, we will concentrate on 8-bit images, meaning that each pixel is represented by a single byte.Since a byte can take on 256 distinct values, L m a x is 255 for an 8-bit image.

Exercise

Download the file yacht.tif for the following section. Click here for help on the Matlab image command .

In order to process images within Matlab, we need to first understand their numerical representation.Download the image file yacht.tif . This is an 8-bit monochrome image.Read it into a matrix using

A = imread('yacht.tif');

Type whos to display your variables. Notice under the "Class" column that the A matrix elements are of type uint8 (unsigned integer, 8 bits). This means that Matlab is using a single byte to represent each pixel.Matlab cannot perform numerical computation on numbers of type uint8 , so we usually need to convert the matrix to a floating point representation.Create a double precision representation of the image using B = double(A); . Again, type whos and notice the difference in the number of bytes between A and B . In future sections, we will be performing computations on our images,so we need to remember to convert them to type double before processing them.

Display yacht.tif using the following sequence of commands:

Questions & Answers

What is inflation
Bright Reply
a general and ongoing rise in the level of prices in an economy
AI-Robot
What are the factors that affect demand for a commodity
Florence Reply
price
Kenu
differentiate between demand and supply giving examples
Lambiv Reply
differentiated between demand and supply using examples
Lambiv
what is labour ?
Lambiv
how will I do?
Venny Reply
how is the graph works?I don't fully understand
Rezat Reply
information
Eliyee
devaluation
Eliyee
t
WARKISA
hi guys good evening to all
Lambiv
multiple choice question
Aster Reply
appreciation
Eliyee
explain perfect market
Lindiwe Reply
In economics, a perfect market refers to a theoretical construct where all participants have perfect information, goods are homogenous, there are no barriers to entry or exit, and prices are determined solely by supply and demand. It's an idealized model used for analysis,
Ezea
What is ceteris paribus?
Shukri Reply
other things being equal
AI-Robot
When MP₁ becomes negative, TP start to decline. Extuples Suppose that the short-run production function of certain cut-flower firm is given by: Q=4KL-0.6K2 - 0.112 • Where is quantity of cut flower produced, I is labour input and K is fixed capital input (K-5). Determine the average product of lab
Kelo
Extuples Suppose that the short-run production function of certain cut-flower firm is given by: Q=4KL-0.6K2 - 0.112 • Where is quantity of cut flower produced, I is labour input and K is fixed capital input (K-5). Determine the average product of labour (APL) and marginal product of labour (MPL)
Kelo
yes,thank you
Shukri
Can I ask you other question?
Shukri
what is monopoly mean?
Habtamu Reply
What is different between quantity demand and demand?
Shukri Reply
Quantity demanded refers to the specific amount of a good or service that consumers are willing and able to purchase at a give price and within a specific time period. Demand, on the other hand, is a broader concept that encompasses the entire relationship between price and quantity demanded
Ezea
ok
Shukri
how do you save a country economic situation when it's falling apart
Lilia Reply
what is the difference between economic growth and development
Fiker Reply
Economic growth as an increase in the production and consumption of goods and services within an economy.but Economic development as a broader concept that encompasses not only economic growth but also social & human well being.
Shukri
production function means
Jabir
What do you think is more important to focus on when considering inequality ?
Abdisa Reply
any question about economics?
Awais Reply
sir...I just want to ask one question... Define the term contract curve? if you are free please help me to find this answer 🙏
Asui
it is a curve that we get after connecting the pareto optimal combinations of two consumers after their mutually beneficial trade offs
Awais
thank you so much 👍 sir
Asui
In economics, the contract curve refers to the set of points in an Edgeworth box diagram where both parties involved in a trade cannot be made better off without making one of them worse off. It represents the Pareto efficient allocations of goods between two individuals or entities, where neither p
Cornelius
In economics, the contract curve refers to the set of points in an Edgeworth box diagram where both parties involved in a trade cannot be made better off without making one of them worse off. It represents the Pareto efficient allocations of goods between two individuals or entities,
Cornelius
Suppose a consumer consuming two commodities X and Y has The following utility function u=X0.4 Y0.6. If the price of the X and Y are 2 and 3 respectively and income Constraint is birr 50. A,Calculate quantities of x and y which maximize utility. B,Calculate value of Lagrange multiplier. C,Calculate quantities of X and Y consumed with a given price. D,alculate optimum level of output .
Feyisa Reply
Answer
Feyisa
c
Jabir
Got questions? Join the online conversation and get instant answers!
Jobilize.com Reply

Get Jobilize Job Search Mobile App in your pocket Now!

Get it on Google Play Download on the App Store Now


Source:  OpenStax, Purdue digital signal processing labs (ece 438). OpenStax CNX. Sep 14, 2009 Download for free at http://cnx.org/content/col10593/1.4
Google Play and the Google Play logo are trademarks of Google Inc.

Notification Switch

Would you like to follow the 'Purdue digital signal processing labs (ece 438)' conversation and receive update notifications?

Ask