

| << Chapter < Page | Chapter >> Page > |
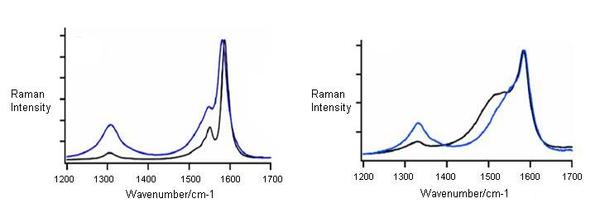
This is one of the most discussed modes for the characterization of functionalized SWNTs and is observed at 1300-1400 cm -1 . Not only for functionalized SWNTs, D-band is also observed for unfunctionalized SWNTs. From a large number of Raman spectra from isolated SWNTs, about 50% exhibit observable D-band signals with weak intensity ( [link] ). A large D-peak compared with the G-peak usually means a bad resonance condition, which indicates the presence of amorphous carbon.
The appearance of D-peak can be interpreted due to the breakdown of the k-selection rule. It also depends on the laser energy and diameter of the SWNTs. This behavior is interpreted as a double resonance effect, where not only one of the direct, k-conserving electronic transitions, but also the emission of phonon is a resonant process. In contrast to single resonant Raman scattering, where only phonons around the center of the Brillouin zone (q = 0) are excited, the phonons that provoke the D-band exhibit a non-negligible q vector. This explains the double resonance theory for D-band in Raman spectroscopy. In few cases, the overtone of the D-band known as the G’-band (or D*-band) is observed at 2600-2800 cm -1 , and it does not require defect scattering as the two phonons with q and –q are excited. This mode is therefore observed independent of the defect concentration.
The presence of D-band cannot be correlated to the presence of various defects (such as hetero-atoms, vacancies, heptagon-pentagon pairs, kinks, or even the presence of impurities, etc). Following are the two main characteristics of the D-band found in carbon nanotubes:
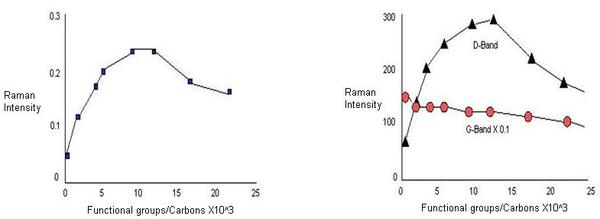
Since D-peak appears due to the presence defects, an increase in the intensity of the band is taken as a fingerprint for successful functionalization. But, whether D-band intensity is a measure of degree of functionalization or not is still sure. So, it is not correct to correlate D-peak intensity or D-peak area to the degree of functionalization. From [link] , it can be observed that for lower degree of functionalization, intensity of the D-band scales linearly with defect density. As the degree of functionalization is further increased, both D and G-band area decrease, which is explained by the loss of resonance enhancement due to functionalization. Also, normalization of the D-peak intensity to the G-band in order to correct for changes in resonance intensities also leads to a decrease for higher densities of functional groups.
Notification Switch
Would you like to follow the 'Nanomaterials and nanotechnology' conversation and receive update notifications?

|
|

|
|

|
|

|
|

|
|

|
|

|
|

|
|
|
|
|
|
|