<< Chapter < Page Chapter >> Page >

Sample morphology has also seen to affect the RBMs. The same unfunctionalized sample in different aggregation states gives rise to different spectra. This is because the transition energy, E ii depends on the aggregation state of the SWNTs.

Tangential modes (g-band)

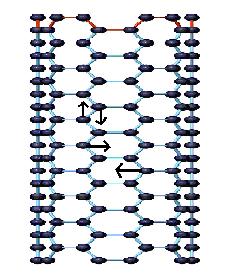
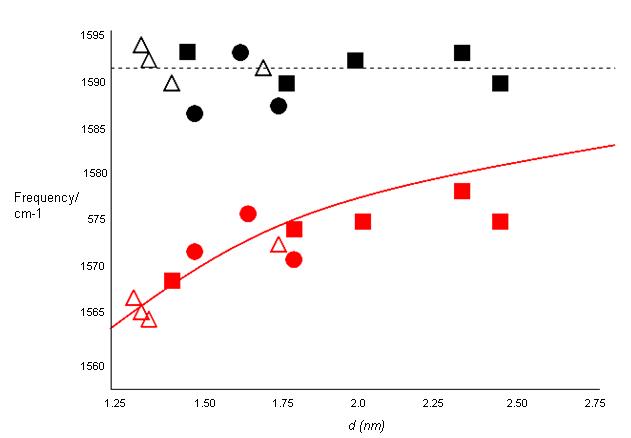
The tangential modes are the most intensive high-energy modes of SWNTs and form the so-called G-band, which is typically observed at around 1600 cm -1 . For this mode, the atomic displacements occur along the cicumferential direction ( [link] ). Spectra in this frequency can be used for SWNT characterization, independent of the RBM observation. This multi-peak feature can, for example, also be used for diameter characterization, although the information provided is less accurate than the RBM feature, and it gives information about the metallic character of the SWNTs in resonance with laser line.

Schematic picture showing the atomic vibrations for the G-band. Adapted from A. Jorio, M. A. Pimenta, A. G. S. Filho, R. Saito, G. Dresselhaus, and M. S. Dresselhaus, New J. Phys. , 2003, 5 , 139.

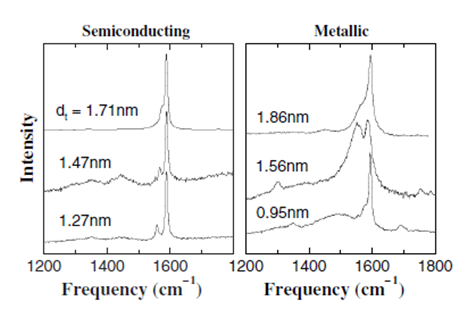
The tangential modes are useful in distinguishing semiconducting from metallic SWNTs. The difference is evident in the G- feature ( [link] and [link] ) which broadens and becomes asymmetric for metallic SWNTs in comparison with the Lorentzian lineshape for semiconducting tubes, and this broadening is related to the presence of free electrons in nanotubes with metallic character. This broadened G-feature is usually fit using a Breit-Wigner-Fano (BWF) line that accounts for the coupling of a discrete phonon with a continuum related to conduction electrons. This BWF line is observed in many graphite-like materials with metallic character, such as n-doped graphite intercalation compounds (GIC), n-doped fullerenes, as well as metallic SWNTs. The intensity of this G- mode depends on the size and number of metallic SWNTs in a bundle ( [link] ).

G-band for highly ordered pyrolytic graphite (HOPG), MWNT bundles, one isolated semiconducting SWNT and one isolated metallic SWNT. The multi-peak G-band feature is not clear for MWNTs due to the large tube size. A. Jorio, M. A. Pimenta, A. G. S. Filho, R. Saito, G. Dresselhaus, and M. S. Dresselhaus, New J. Phys. , 2003, 5 , 139. Copyright Institute of Physics (2005).
Raman signal from three isolated semiconducting and three isolated metallic SWNTs showing the G-and D-band profiles. SWNTs in good resonance (strong signal with low signal to noise ratio) show practically no D-band. A. Jorio, M. A. Pimenta, A. G. S. Filho, R. Saito, G. Dresselhaus, and M. S. Dresselhaus, New J. Phys. , 2003, 5 , 139. Copyright Institute of Physics (2005).
Dependence of G+ (black symbols) and G- (red symbols) frequencies as a function of diameter. Adapted from M. Paillet, T. Michel, J. C. Meyer, V. N. Popov, L. Henrad, S. Roth, and J. L. Sauvajol, Phy. Rev. Lett. , 2006, 96 , 257401.

Change of g-band line shape on functionalization

Chemical treatments are found to affect the line shape of the tangential line modes. Selective functionalization of SWNTs or a change in the ratio of metallic to semiconducting SWNTs due to selective etching is responsible for such a change. According to [link] , it can be seen that an increase or decrease of the BWF line shape is observed depending on the laser wavelength. At λ exc = 633 nm, the preferentially functionalized small diameter SWNTs are semiconducting, therefore the G-band shows a decrease in the BWG asymmetry. However, the situation is reversed at 514 nm, where small metallic tubes are probed. BWF resonance intensity of small bundles increases with bundle thickness, so care should be taken that the effect ascribed directly to functionalization of the SWNTs is not caused by the exfoliation of the previously bundles SWNT.

Questions & Answers

Examine the distinction between theory of comparative cost Advantage and theory of factor proportion
Fatima Reply
What is inflation
Bright Reply
a general and ongoing rise in the level of prices in an economy
AI-Robot
What are the factors that affect demand for a commodity
Florence Reply
price
Kenu
differentiate between demand and supply giving examples
Lambiv Reply
differentiated between demand and supply using examples
Lambiv
what is labour ?
Lambiv
how will I do?
Venny Reply
how is the graph works?I don't fully understand
Rezat Reply
information
Eliyee
devaluation
Eliyee
t
WARKISA
hi guys good evening to all
Lambiv
multiple choice question
Aster Reply
appreciation
Eliyee
explain perfect market
Lindiwe Reply
In economics, a perfect market refers to a theoretical construct where all participants have perfect information, goods are homogenous, there are no barriers to entry or exit, and prices are determined solely by supply and demand. It's an idealized model used for analysis,
Ezea
What is ceteris paribus?
Shukri Reply
other things being equal
AI-Robot
When MP₁ becomes negative, TP start to decline. Extuples Suppose that the short-run production function of certain cut-flower firm is given by: Q=4KL-0.6K2 - 0.112 • Where is quantity of cut flower produced, I is labour input and K is fixed capital input (K-5). Determine the average product of lab
Kelo
Extuples Suppose that the short-run production function of certain cut-flower firm is given by: Q=4KL-0.6K2 - 0.112 • Where is quantity of cut flower produced, I is labour input and K is fixed capital input (K-5). Determine the average product of labour (APL) and marginal product of labour (MPL)
Kelo
yes,thank you
Shukri
Can I ask you other question?
Shukri
what is monopoly mean?
Habtamu Reply
What is different between quantity demand and demand?
Shukri Reply
Quantity demanded refers to the specific amount of a good or service that consumers are willing and able to purchase at a give price and within a specific time period. Demand, on the other hand, is a broader concept that encompasses the entire relationship between price and quantity demanded
Ezea
ok
Shukri
how do you save a country economic situation when it's falling apart
Lilia Reply
what is the difference between economic growth and development
Fiker Reply
Economic growth as an increase in the production and consumption of goods and services within an economy.but Economic development as a broader concept that encompasses not only economic growth but also social & human well being.
Shukri
production function means
Jabir
What do you think is more important to focus on when considering inequality ?
Abdisa Reply
any question about economics?
Awais Reply
sir...I just want to ask one question... Define the term contract curve? if you are free please help me to find this answer 🙏
Asui
it is a curve that we get after connecting the pareto optimal combinations of two consumers after their mutually beneficial trade offs
Awais
thank you so much 👍 sir
Asui
In economics, the contract curve refers to the set of points in an Edgeworth box diagram where both parties involved in a trade cannot be made better off without making one of them worse off. It represents the Pareto efficient allocations of goods between two individuals or entities, where neither p
Cornelius
In economics, the contract curve refers to the set of points in an Edgeworth box diagram where both parties involved in a trade cannot be made better off without making one of them worse off. It represents the Pareto efficient allocations of goods between two individuals or entities,
Cornelius
Got questions? Join the online conversation and get instant answers!
Jobilize.com Reply

Get Jobilize Job Search Mobile App in your pocket Now!

Get it on Google Play Download on the App Store Now


Source:  OpenStax, Nanomaterials and nanotechnology. OpenStax CNX. May 07, 2014 Download for free at http://legacy.cnx.org/content/col10700/1.13
Google Play and the Google Play logo are trademarks of Google Inc.

Notification Switch

Would you like to follow the 'Nanomaterials and nanotechnology' conversation and receive update notifications?

Ask