<< Chapter < Page Chapter >> Page >

Reflection of a pulse from fixed and free ends

Let us now consider what happens to a pulse when it reaches the end of a medium. The medium can be fixed, like a rope tied to a wall, or it can be free, like a rope tied loosely to a pole.

Reflection of a pulse from a fixed end

Investigation : reflection of a pulse from a fixed end

Tie a rope to a wall or some other object that cannot move. Create a pulse in the rope by flicking one end up and down. Observe what happens to the pulse when it reaches the wall.

Reflection of a pulse from a fixed end.

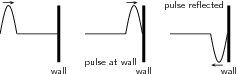
When the end of the medium is fixed, for example a rope tied to a wall, a pulse reflects from the fixed end, but the pulse is inverted (i.e. it is upside-down). This is shown in [link] .

Reflection of a pulse from a free end

Investigation : reflection of a pulse from a free end

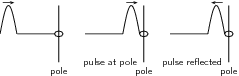
Tie a rope to a pole in such a way that the rope can move up and down the pole. Create a pulse in the rope by flicking one end up and down. Observe what happens to the pulse when it reaches the pole.

When the end of the medium is free, for example a rope tied loosely to a pole, a pulse reflects from the free end, but the pulse is not inverted . This is shown in [link] . We draw the free end as a ring around the pole. The ring will move up and down the pole, while the pulse is reflected away from the pole.

Reflection of a pulse from a free end.
The fixed and free ends that were discussed in this section are examples of boundary conditions . You will see more of boundary conditions as you progress in the Physics syllabus.

Pulses at a boundary ii

  1. A rope is tied to a tree and a single pulse is generated. What happens to the pulse as it reaches the tree? Draw a diagram to explain what happens.
  2. A rope is tied to a ring that is loosely fitted around a pole. A single pulse is sent along the rope. What will happen to the pulse as it reaches the pole? Draw a diagram to explain your answer.

The following simulation will help you understand the previous examples. Choose pulse from the options (either manual, oscillate or pulse). Then click on pulse and see what happens. Change from a fixed to a free end and see what happens. Try varying the width, amplitude, damping and tension.

Phet simulation for transverse pulses

Superposition of pulses

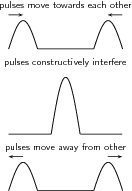
Two or more pulses can pass through the same medium at that same time. The resulting pulse is obtained by using the principle of superposition . The principle of superposition states that the effect of the pulses is the sum of their individual effects. After pulses pass through each other, each pulse continues along its original direction of travel, and their original amplitudes remain unchanged.

Constructive interference takes place when two pulses meet each other to create a larger pulse. The amplitude of the resulting pulse is the sum of the amplitudes of the two initial pulses. This is shown in [link] .

Constructive interference is when two pulses meet, resulting in a bigger pulse.
Superposition of two pulses: constructive interference.

Questions & Answers

What is inflation
Bright Reply
a general and ongoing rise in the level of prices in an economy
AI-Robot
What are the factors that affect demand for a commodity
Florence Reply
price
Kenu
differentiate between demand and supply giving examples
Lambiv Reply
differentiated between demand and supply using examples
Lambiv
what is labour ?
Lambiv
how will I do?
Venny Reply
how is the graph works?I don't fully understand
Rezat Reply
information
Eliyee
devaluation
Eliyee
t
WARKISA
hi guys good evening to all
Lambiv
multiple choice question
Aster Reply
appreciation
Eliyee
explain perfect market
Lindiwe Reply
In economics, a perfect market refers to a theoretical construct where all participants have perfect information, goods are homogenous, there are no barriers to entry or exit, and prices are determined solely by supply and demand. It's an idealized model used for analysis,
Ezea
What is ceteris paribus?
Shukri Reply
other things being equal
AI-Robot
When MP₁ becomes negative, TP start to decline. Extuples Suppose that the short-run production function of certain cut-flower firm is given by: Q=4KL-0.6K2 - 0.112 • Where is quantity of cut flower produced, I is labour input and K is fixed capital input (K-5). Determine the average product of lab
Kelo
Extuples Suppose that the short-run production function of certain cut-flower firm is given by: Q=4KL-0.6K2 - 0.112 • Where is quantity of cut flower produced, I is labour input and K is fixed capital input (K-5). Determine the average product of labour (APL) and marginal product of labour (MPL)
Kelo
yes,thank you
Shukri
Can I ask you other question?
Shukri
what is monopoly mean?
Habtamu Reply
What is different between quantity demand and demand?
Shukri Reply
Quantity demanded refers to the specific amount of a good or service that consumers are willing and able to purchase at a give price and within a specific time period. Demand, on the other hand, is a broader concept that encompasses the entire relationship between price and quantity demanded
Ezea
ok
Shukri
how do you save a country economic situation when it's falling apart
Lilia Reply
what is the difference between economic growth and development
Fiker Reply
Economic growth as an increase in the production and consumption of goods and services within an economy.but Economic development as a broader concept that encompasses not only economic growth but also social & human well being.
Shukri
production function means
Jabir
What do you think is more important to focus on when considering inequality ?
Abdisa Reply
any question about economics?
Awais Reply
sir...I just want to ask one question... Define the term contract curve? if you are free please help me to find this answer 🙏
Asui
it is a curve that we get after connecting the pareto optimal combinations of two consumers after their mutually beneficial trade offs
Awais
thank you so much 👍 sir
Asui
In economics, the contract curve refers to the set of points in an Edgeworth box diagram where both parties involved in a trade cannot be made better off without making one of them worse off. It represents the Pareto efficient allocations of goods between two individuals or entities, where neither p
Cornelius
In economics, the contract curve refers to the set of points in an Edgeworth box diagram where both parties involved in a trade cannot be made better off without making one of them worse off. It represents the Pareto efficient allocations of goods between two individuals or entities,
Cornelius
Suppose a consumer consuming two commodities X and Y has The following utility function u=X0.4 Y0.6. If the price of the X and Y are 2 and 3 respectively and income Constraint is birr 50. A,Calculate quantities of x and y which maximize utility. B,Calculate value of Lagrange multiplier. C,Calculate quantities of X and Y consumed with a given price. D,alculate optimum level of output .
Feyisa Reply
Answer
Feyisa
c
Jabir
Got questions? Join the online conversation and get instant answers!
Jobilize.com Reply

Get Jobilize Job Search Mobile App in your pocket Now!

Get it on Google Play Download on the App Store Now


Source:  OpenStax, Siyavula textbooks: grade 10 physical science. OpenStax CNX. Aug 29, 2011 Download for free at http://cnx.org/content/col11245/1.3
Google Play and the Google Play logo are trademarks of Google Inc.

Notification Switch

Would you like to follow the 'Siyavula textbooks: grade 10 physical science' conversation and receive update notifications?

Ask