<< Chapter < Page Chapter >> Page >

Natuurwetenskappe

Graad 4

Materie en stowwe

Module 56

Die waarde van boumateriaal as 'n hulpbron

Aktiwiteit:

Om die waarde van boumateriaal as ‘n hulpbron in die bou van huise te leer ken

[lu 1.2.1, 2.2.1, 3.2]

Boumateriale

Wanneer ‘n huis gebou word, word materiale gebruik wat natuurlik is of wat gemaak moes word. Hier is ‘n prentjie van ‘n huisie. Kleur die natuurlike materiale geel in en die ander materiale rooi.

Hout

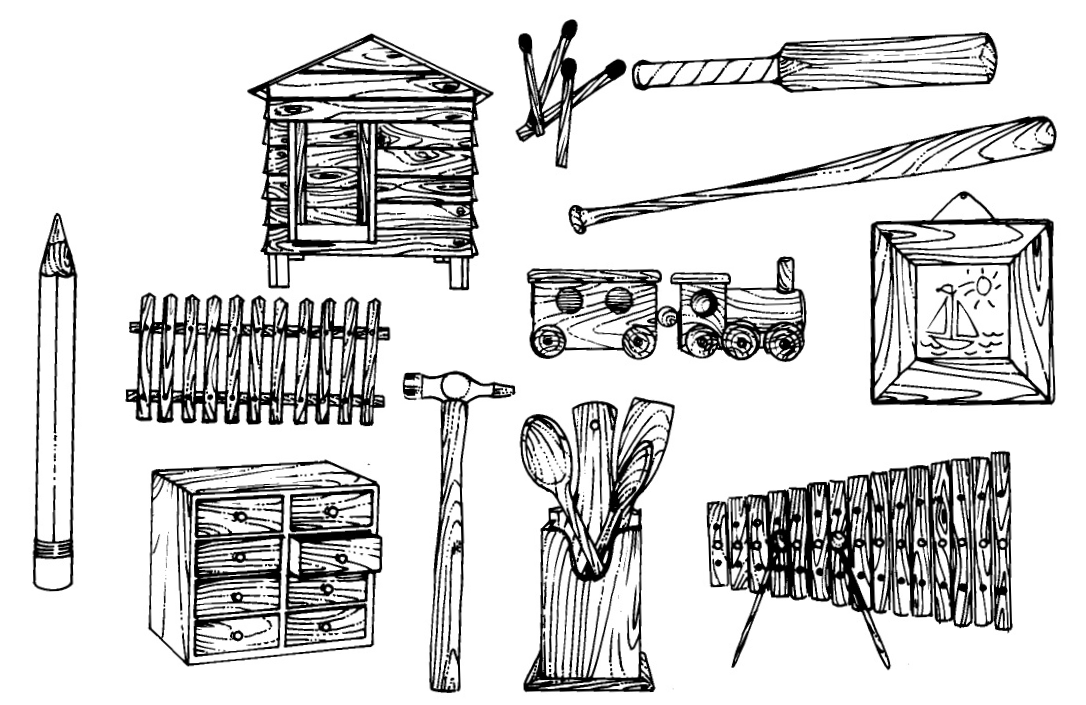
Een van die natuurlike produkte wat gebruik is om die huisie te bou, is hout.

Hout is ‘n wonderlike hulpbron vir die mens. Deel die klas in ses groepe. Gee drie minute kans om alles te lys wat van hout gemaak is in die:

klas

jou kamer by die huis

jou sitkamer by die huis

die kombuis

op die skoolterrein

I

in die skoolsaal

1. Watter gevolgtrekking kan jy hieruit maak?

My gevolgtrekking is: ____________________________
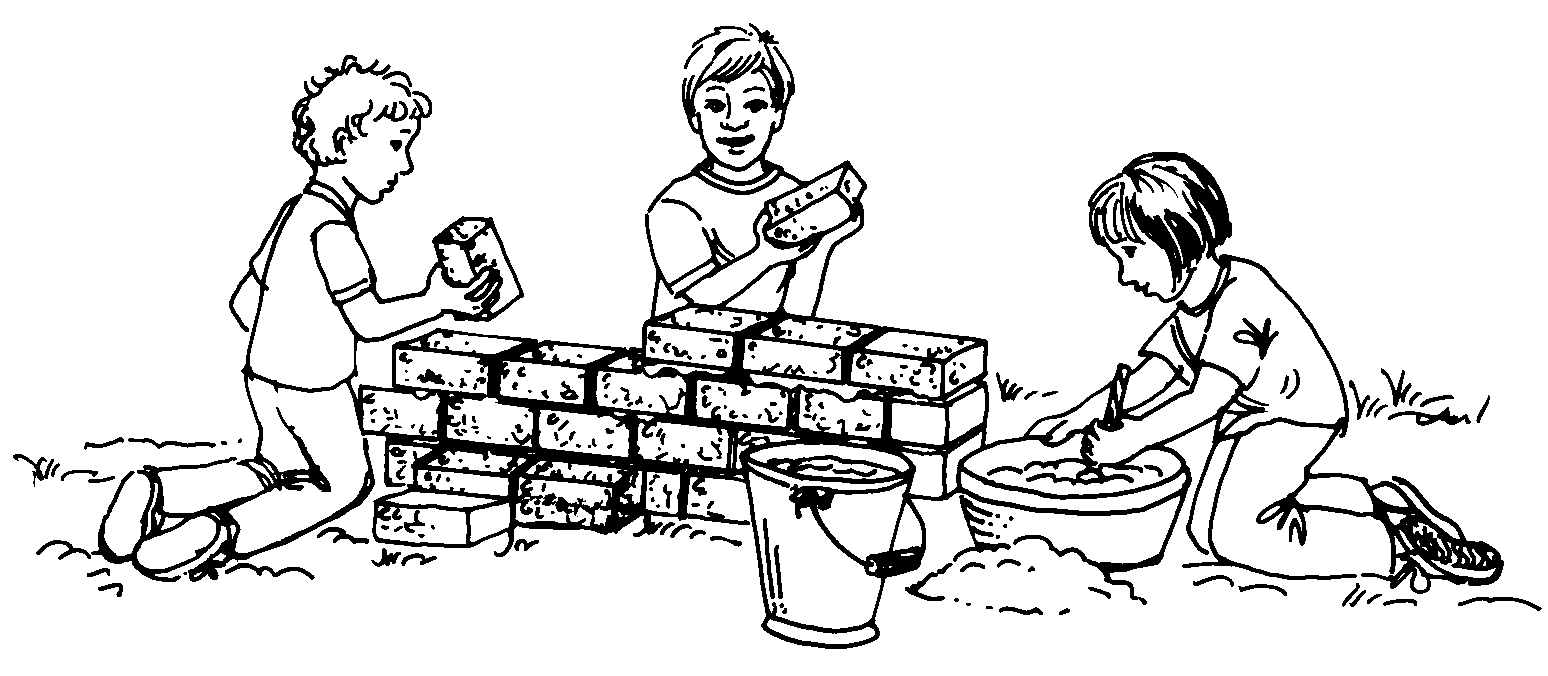
  1. Skryf aan Sappi om plakkate aan julle klas te stuur.

Bakstene

Om mee te skryf

Duisende jare gelede het mense allerhande maniere gebruik om te skryf. Hulle het materiale van dierprodukte, klippe, plante en klei gebruik. Hulle het op papirus, bas, dierevelle en rotse geskryf en tekeninge gemaak.

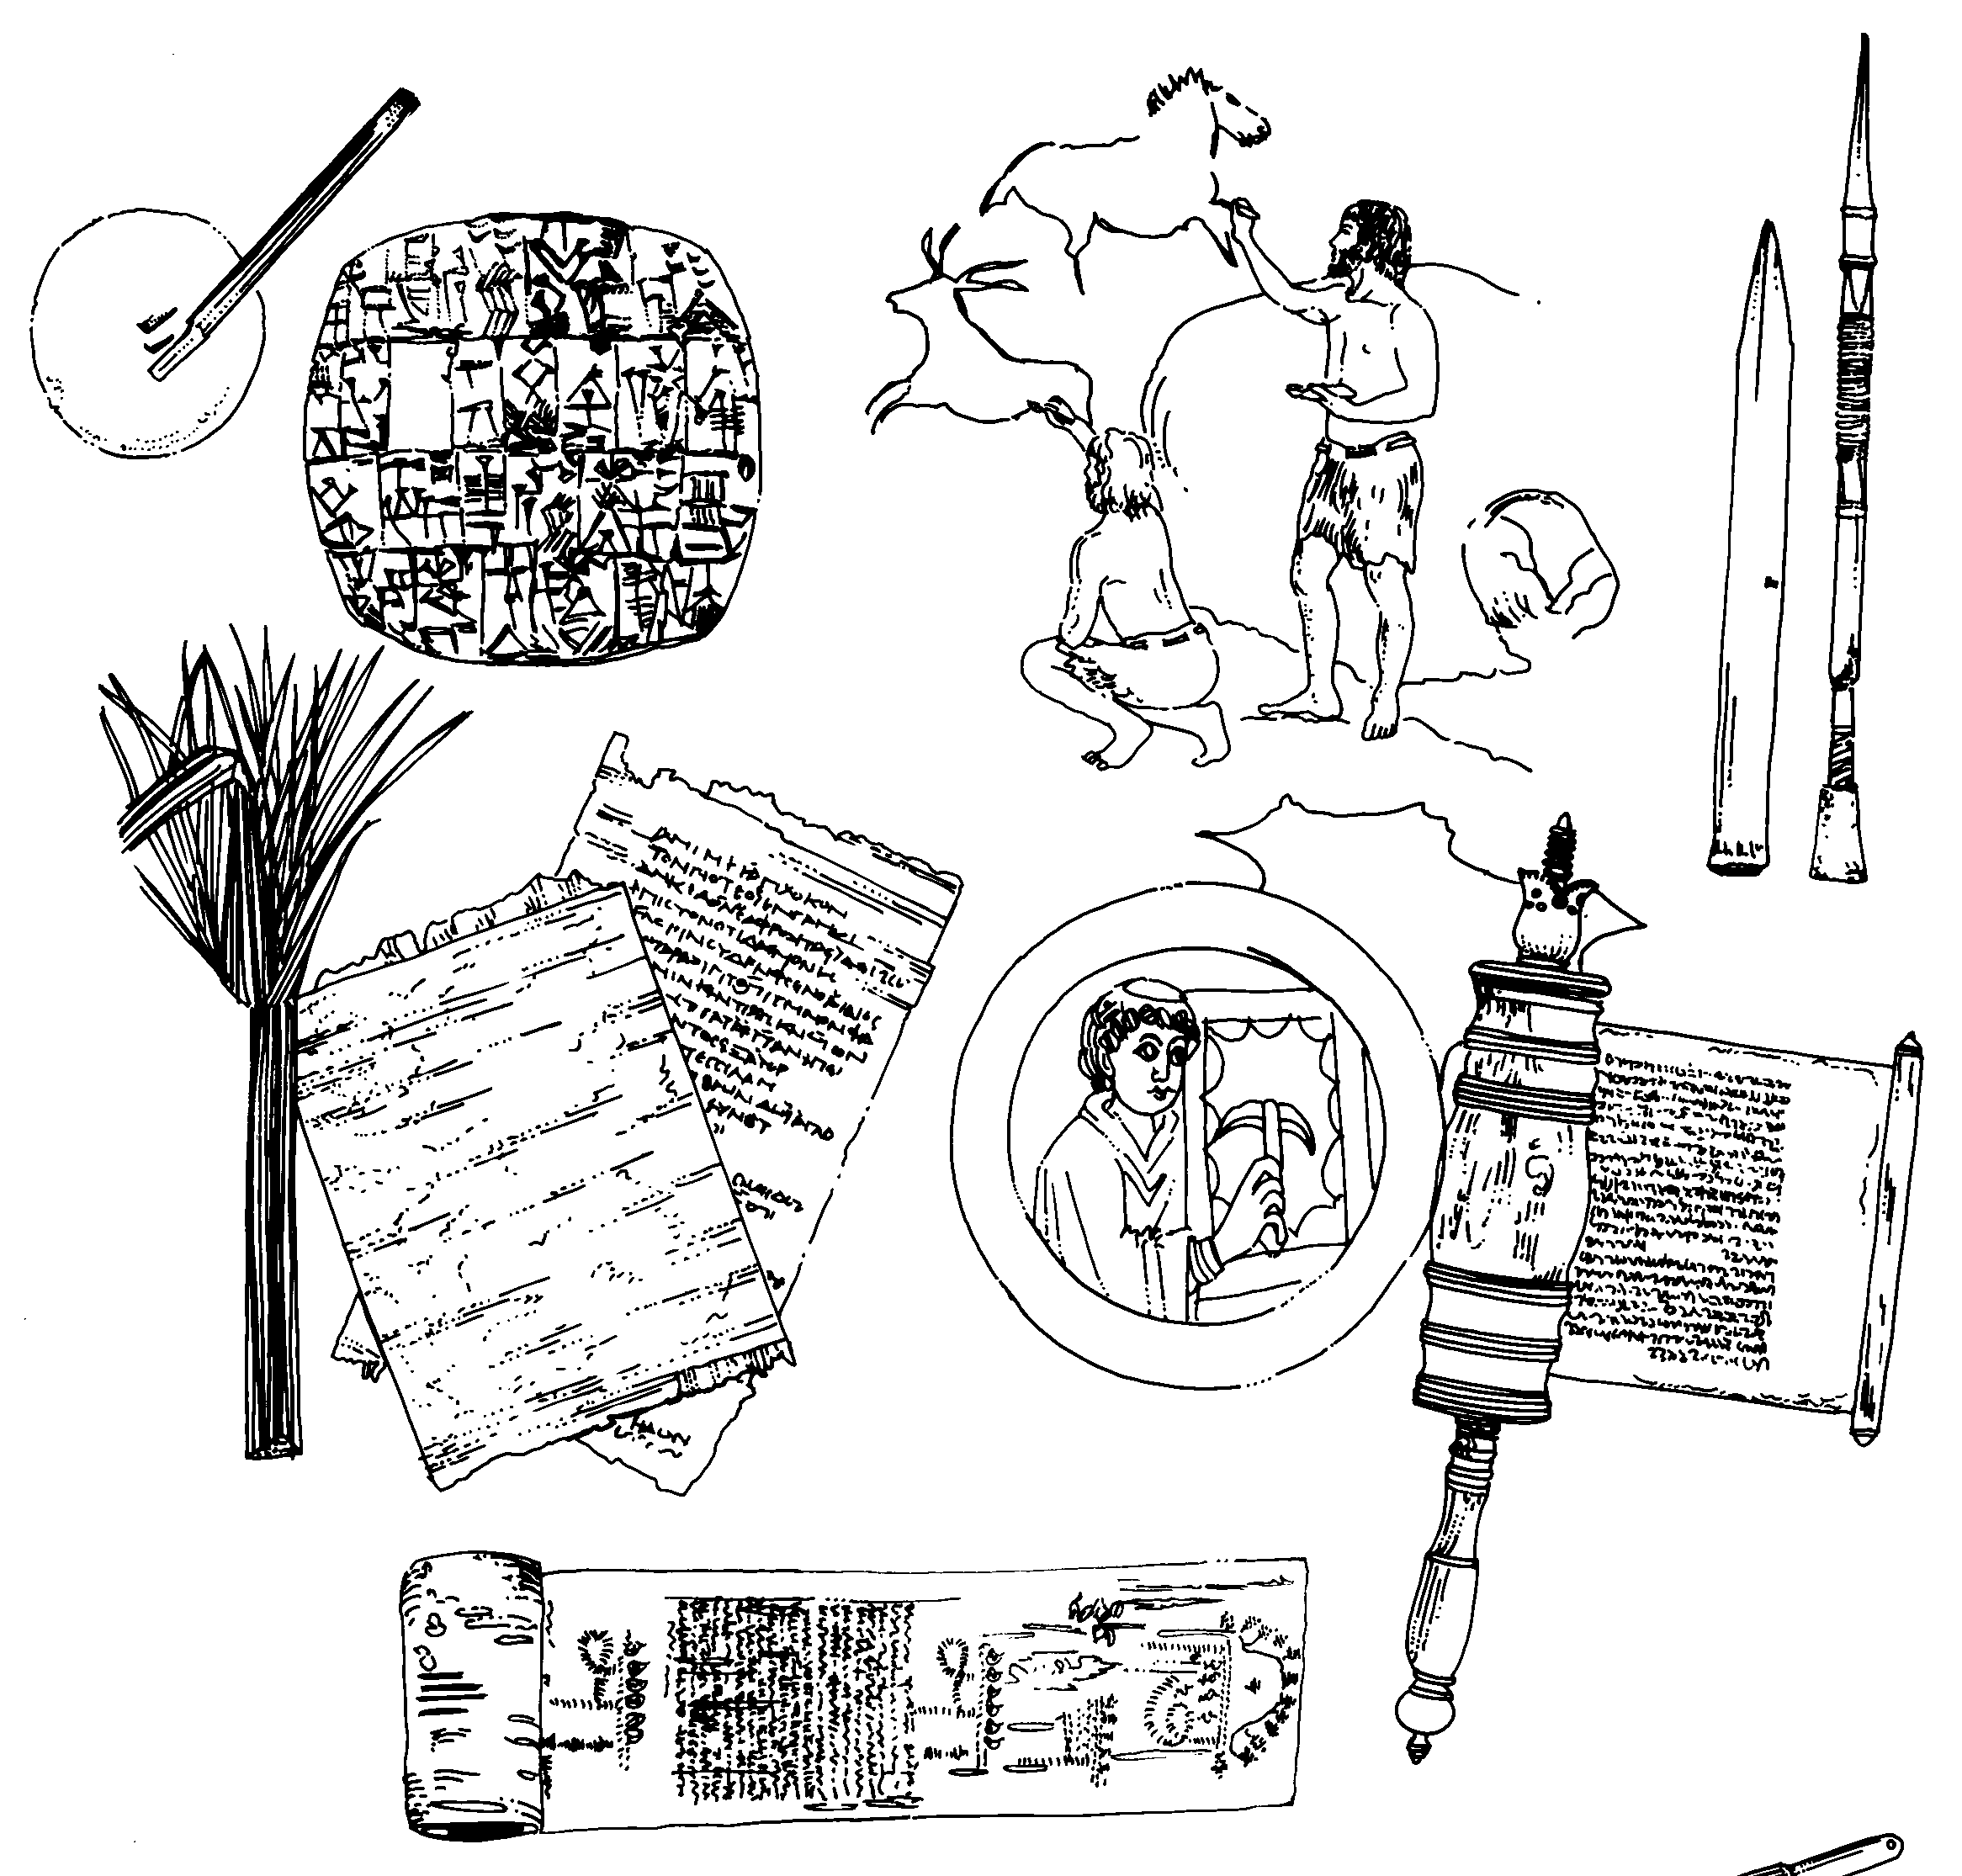
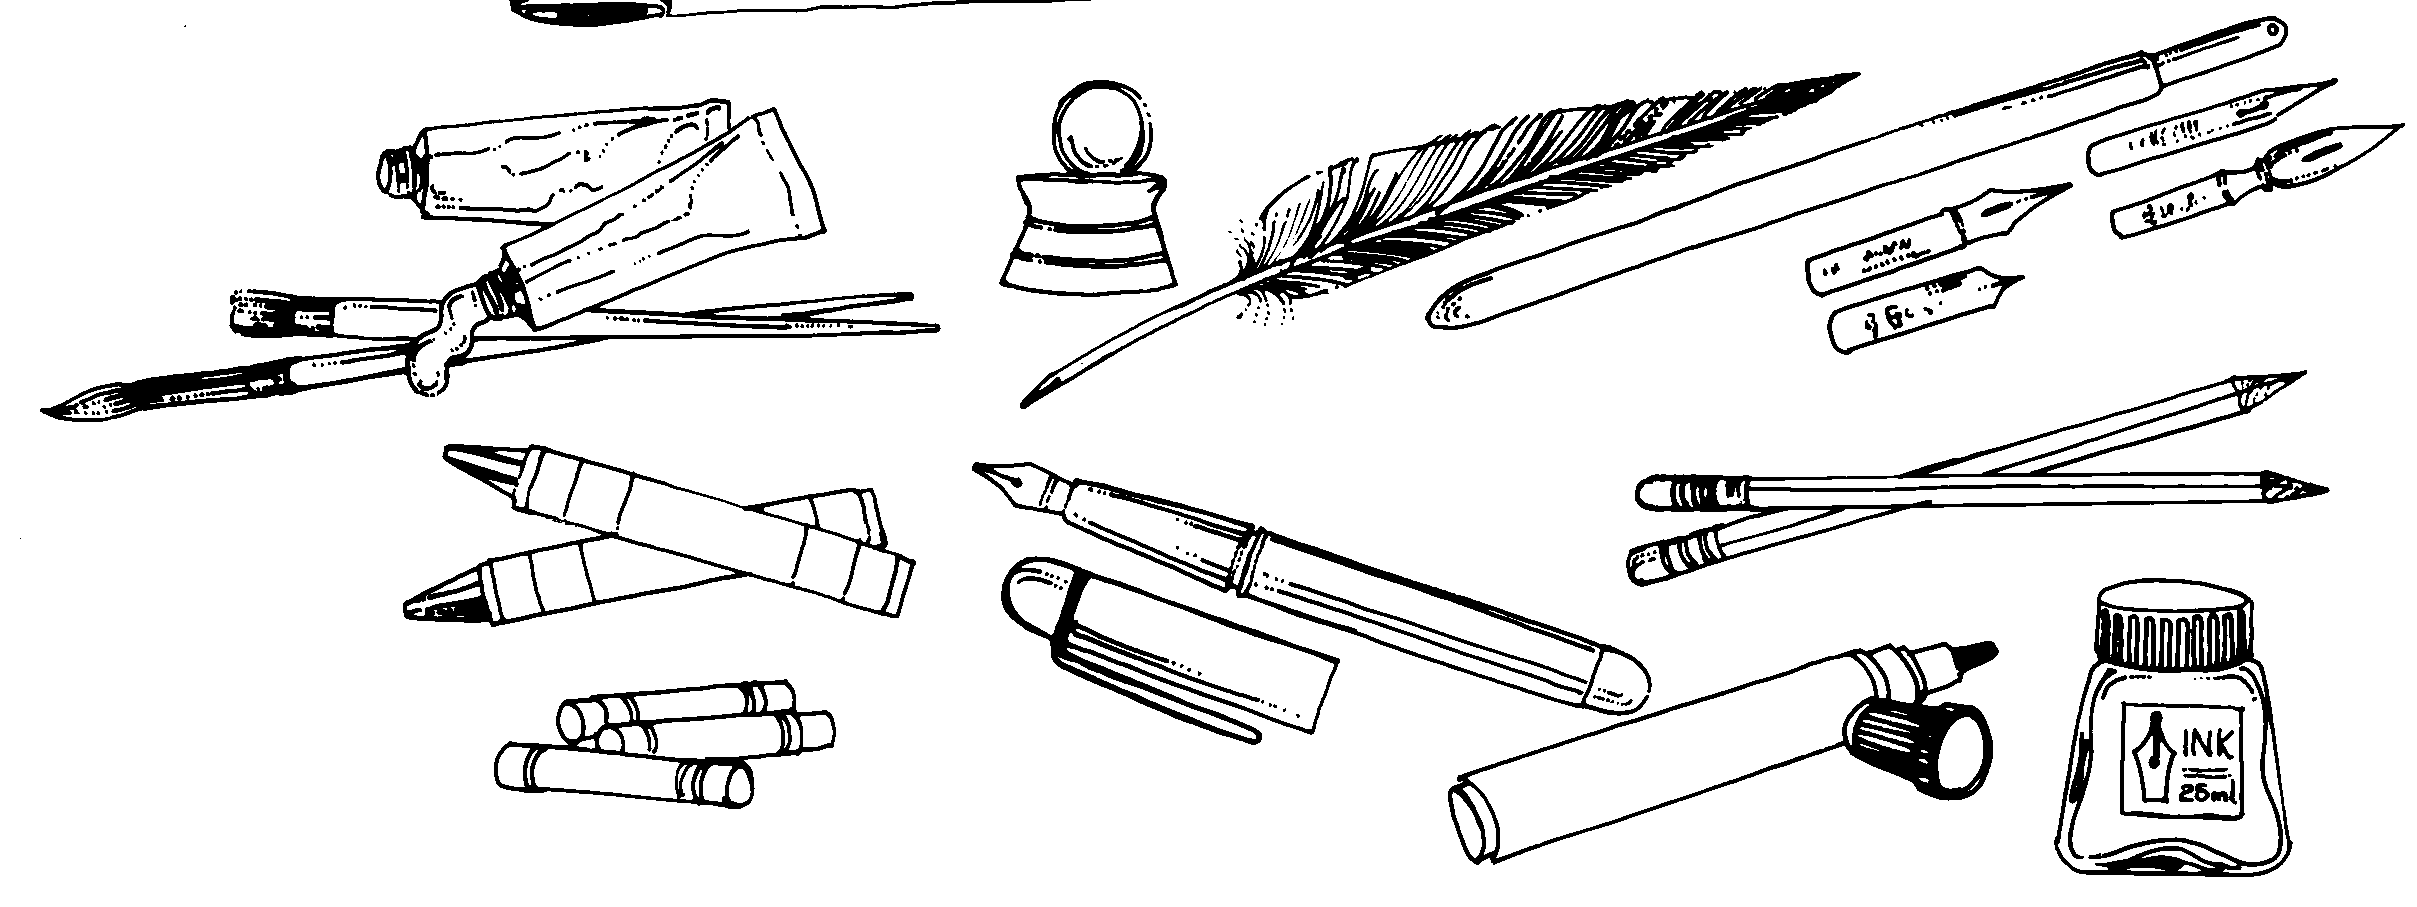
Vandag is dit baie makliker. Ons gaan net eenvoudig winkels toe en koop die wonderlikste skryfgoed wat ons wil hê. Al hierdie goed word van verskillende soorte materie gemaak.

Dink aan iemand uit ons verre verlede wat jou nog altyd gefassineer het. Stuur ‘n kort SMS-boodskap aan hom/haar om te bewys hoe die tegnologie oor ‘skryf’ deur die jare verander het.

Assessering

LEERUITKOMS 1: WETENSKAPLIKE ONDERSOEK

Die l eerder is in staat om met selfvertroue op weetgierigheid oor natuurlike verskynsels te reageer, en om binne die konteks van wetenskap, tegnologie en die omgewing verbande te ondersoek en probleme op te los.

Assesseringstandaard

Dis duidelik wanneer die leerder

1.2 ondersoeke uitvoer en data versamel, bv.:

1.2.1 merk ooglopende veranderings of interessante besonderhede op en lewer kommentaar daarop.

LEERUITKOMS 2: KONSTRUKSIE VAN WETENSKAPKENNIS Die leerder ken, interpreteer en pas wetenskaplike, tegnologiese en omgewings- kennis toe.

Assesseringstandaard

Dis duidelik wanneer die leerder

2.2 inligting kategoriseer, bv.:

2.2.1 volg instruksies om diere in groepe van dié met twee bene, met vier bene en met meer as vier bene te sorteer.

LEERUITKOMS 3: WETENSKAP, DIE SAMELEWING EN DIE OMGEWING Die leerder is in staat om begrip van die onderlinge verband tussen wetenskap en tegnologie, die samelewing en die omgewing te toon .

Assesseringstandaard

Dis duidelik wanneer die leerder

3.2 die impak van wetenskap en tegnologie verstaan.

Memorandum

Boumateriale:

  • Natuurlike materiale: kleur dit geel in
  • Ander materiale: kleur dit rooi in

Om mee te skryf:

  • Kinders ken nie die outydse maniere van skryf nie. Indien daar tyd is, lees outydse artikels, stories of kyk video’s wat dit mooi uitbeeld.
  • Die SMS-boodskap is iets wat hulle baie goed ken!

Questions & Answers

What is inflation
Bright Reply
a general and ongoing rise in the level of prices in an economy
AI-Robot
What are the factors that affect demand for a commodity
Florence Reply
price
Kenu
differentiate between demand and supply giving examples
Lambiv Reply
differentiated between demand and supply using examples
Lambiv
what is labour ?
Lambiv
how will I do?
Venny Reply
how is the graph works?I don't fully understand
Rezat Reply
information
Eliyee
devaluation
Eliyee
t
WARKISA
hi guys good evening to all
Lambiv
multiple choice question
Aster Reply
appreciation
Eliyee
explain perfect market
Lindiwe Reply
In economics, a perfect market refers to a theoretical construct where all participants have perfect information, goods are homogenous, there are no barriers to entry or exit, and prices are determined solely by supply and demand. It's an idealized model used for analysis,
Ezea
What is ceteris paribus?
Shukri Reply
other things being equal
AI-Robot
When MP₁ becomes negative, TP start to decline. Extuples Suppose that the short-run production function of certain cut-flower firm is given by: Q=4KL-0.6K2 - 0.112 • Where is quantity of cut flower produced, I is labour input and K is fixed capital input (K-5). Determine the average product of lab
Kelo
Extuples Suppose that the short-run production function of certain cut-flower firm is given by: Q=4KL-0.6K2 - 0.112 • Where is quantity of cut flower produced, I is labour input and K is fixed capital input (K-5). Determine the average product of labour (APL) and marginal product of labour (MPL)
Kelo
yes,thank you
Shukri
Can I ask you other question?
Shukri
what is monopoly mean?
Habtamu Reply
What is different between quantity demand and demand?
Shukri Reply
Quantity demanded refers to the specific amount of a good or service that consumers are willing and able to purchase at a give price and within a specific time period. Demand, on the other hand, is a broader concept that encompasses the entire relationship between price and quantity demanded
Ezea
ok
Shukri
how do you save a country economic situation when it's falling apart
Lilia Reply
what is the difference between economic growth and development
Fiker Reply
Economic growth as an increase in the production and consumption of goods and services within an economy.but Economic development as a broader concept that encompasses not only economic growth but also social & human well being.
Shukri
production function means
Jabir
What do you think is more important to focus on when considering inequality ?
Abdisa Reply
any question about economics?
Awais Reply
sir...I just want to ask one question... Define the term contract curve? if you are free please help me to find this answer 🙏
Asui
it is a curve that we get after connecting the pareto optimal combinations of two consumers after their mutually beneficial trade offs
Awais
thank you so much 👍 sir
Asui
In economics, the contract curve refers to the set of points in an Edgeworth box diagram where both parties involved in a trade cannot be made better off without making one of them worse off. It represents the Pareto efficient allocations of goods between two individuals or entities, where neither p
Cornelius
In economics, the contract curve refers to the set of points in an Edgeworth box diagram where both parties involved in a trade cannot be made better off without making one of them worse off. It represents the Pareto efficient allocations of goods between two individuals or entities,
Cornelius
Suppose a consumer consuming two commodities X and Y has The following utility function u=X0.4 Y0.6. If the price of the X and Y are 2 and 3 respectively and income Constraint is birr 50. A,Calculate quantities of x and y which maximize utility. B,Calculate value of Lagrange multiplier. C,Calculate quantities of X and Y consumed with a given price. D,alculate optimum level of output .
Feyisa Reply
Answer
Feyisa
c
Jabir
Got questions? Join the online conversation and get instant answers!
Jobilize.com Reply

Get Jobilize Job Search Mobile App in your pocket Now!

Get it on Google Play Download on the App Store Now


Source:  OpenStax, Natuurwetenskappe graad 4. OpenStax CNX. Sep 18, 2009 Download for free at http://cnx.org/content/col11097/1.1
Google Play and the Google Play logo are trademarks of Google Inc.

Notification Switch

Would you like to follow the 'Natuurwetenskappe graad 4' conversation and receive update notifications?

Ask