

| << Chapter < Page | Chapter >> Page > |
This section describes the graphs of trigonometric functions.
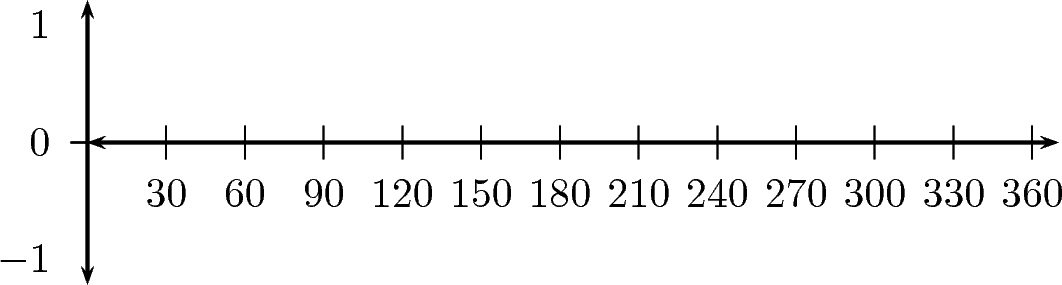
Complete the following table, using your calculator to calculate the values. Then plot the values with on the -axis and on the -axis. Round answers to 1 decimal place.
| 0 | 30 | 60 | 90 | 120 | 150 | ||
| 180 | 210 | 240 | 270 | 300 | 330 | 360 | |
 |
Let us look back at our values for
| 0 | 1 | 0 |
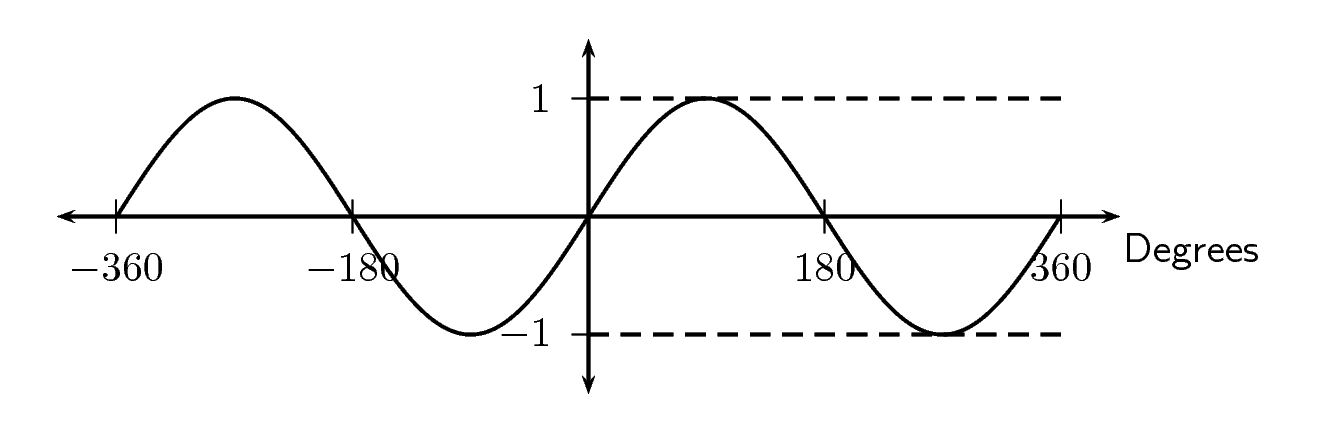
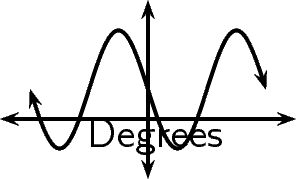
As you can see, the function has a value of 0 at . Its value then smoothly increases until when its value is 1. We also know that it later decreases to 0 when . Putting all this together we can start to picture the full extent of the sine graph. The sine graph is shown in [link] . Notice the wave shape, with each wave having a length of . We say the graph has a period of . The height of the wave above (or below) the -axis is called the wave's amplitude . Thus the maximum amplitude of the sine-wave is 1, and its minimum amplitude is -1.
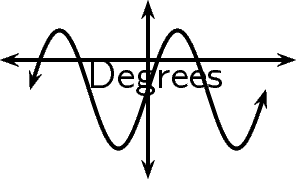
In the equation, , and are constants and have different effects on the graph of the function. The general shape of the graph of functions of this form is shown in [link] for the function .
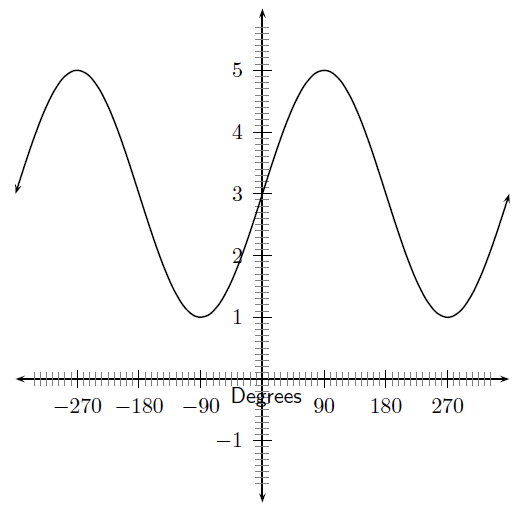
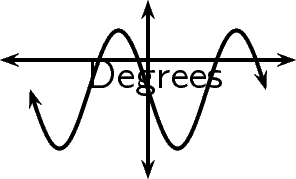
You should have found that the value of affects the height of the peaks of the graph. As the magnitude of increases, the peaks get higher. As it decreases, the peaks get lower.
is called the vertical shift . If , then the whole sine graph shifts up 2 units. If , the whole sine graph shifts down 1 unit.
These different properties are summarised in [link] .
 |
 | |
 |
 |
For , the domain is because there is no value of for which is undefined.
The range of depends on whether the value for is positive or negative. We will consider these two cases separately.
If we have:
This tells us that for all values of , is always between and . Therefore if , the range of is .
Similarly, it can be shown that if , the range of is . This is left as an exercise.
The -intercept, , of is simply the value of at .
Complete the following table, using your calculator to calculate the values correct to 1 decimal place. Then plot the values with on the -axis and on the -axis.
| 0 | 30 | 60 | 90 | 120 | 150 | ||
| 180 | 210 | 240 | 270 | 300 | 330 | 360 | |
 |
Notification Switch
Would you like to follow the 'Siyavula textbooks: grade 10 maths [caps]' conversation and receive update notifications?

|
|

|
|

|
|

|
|

|
|

|
|

|
|

|
|
|
|
|
|
|