<< Chapter < Page Chapter >> Page >

Bearing

The final method of expressing direction is to use a bearing . A bearing is a direction relative to a fixed point.

Given just an angle, the convention is to define the angle with respect to the North. So, a vector with a direction of 110 has been rotated clockwise 110 relative to the North. A bearing is always written as a three digit number, for example 275 or 080 (for 80 ).

Scalars and vectors

  1. Classify the following quantities as scalars or vectors:
    1. 12 km
    2. 1 m south
    3. 2 m · s - 1 , 45
    4. 075 , 2 cm
    5. 100 k · h - 1 , 0
  2. Use two different notations to write down the direction of the vector in each of the following diagrams:

Drawing vectors

In order to draw a vector accurately we must specify a scale and include a reference direction in the diagram. A scale allows us totranslate the length of the arrow into the vector's magnitude. For instance if one chose a scale of 1 cm = 2 N (1 cm represents 2 N), aforce of 20 N towards the East would be represented as an arrow 10 cm long. A reference direction may be a line representing a horizontal surface or the points of a compass.

Method: Drawing Vectors

  1. Decide upon a scale and write it down.
  2. Determine the length of the arrow representing the vector, by using the scale.
  3. Draw the vector as an arrow. Make sure that you fill in the arrow head.
  4. Fill in the magnitude of the vector.

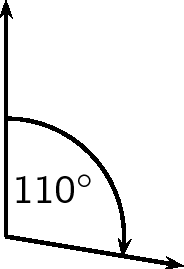
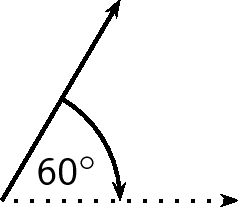
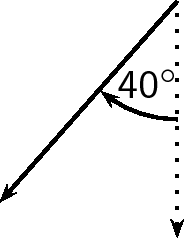
Represent the following vector quantities:

  1. 6 m · s - 1 north
  2. 16 m east
    1. 1 cm = 2 m · s - 1
    2. 1 cm = 4 m
    1. If 1 cm = 2 m · s - 1 , then 6 m · s - 1 = 3 cm
    2. If 1 cm = 4 m , then 16 m = 4 cm
    1. Scale used: 1 cm = 2 m · s - 1 Direction = North
    2. Scale used: 1 cm = 4 m Direction = East

Drawing vectors

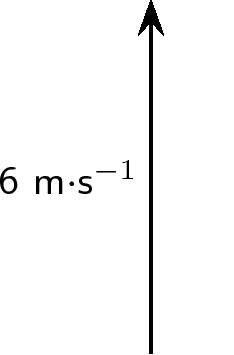
Draw each of the following vectors to scale. Indicate the scale that you have used:

  1. 12 km south
  2. 1,5 m N 45 W
  3. 1 m · s - 1 , 20 East of North
  4. 50 km · h - 1 , 085
  5. 5 mm, 225

Mathematical properties of vectors

Vectors are mathematical objects and we need to understand the mathematical properties of vectors, like adding and subtracting.

For all the examples in this section, we will use displacement as our vector quantity. Displacement was discussed in Grade 10.

Displacement is defined as the distance together with direction of the straight line joining a final point to an initial point.

Remember that displacement is just one example of a vector. We could just as well have decided to use forces or velocities to illustrate the properties of vectors.

Adding vectors

When vectors are added, we need to add both a magnitude and a direction. For example, take 2 steps in the forward direction, stop and then take another 3 steps in the forward direction. The first 2 steps is a displacement vector and the second 3 steps is also a displacement vector. If we did not stop after the first 2 steps, we would have taken 5 steps in the forward direction in total. Therefore, if we add the displacement vectors for 2 steps and 3 steps, we should get a total of 5 steps in the forward direction. Graphically, this can be seen by first following the first vector two steps forward and then following the second one three steps forward (ie. in the same direction):

Questions & Answers

What is inflation
Bright Reply
a general and ongoing rise in the level of prices in an economy
AI-Robot
What are the factors that affect demand for a commodity
Florence Reply
price
Kenu
differentiate between demand and supply giving examples
Lambiv Reply
differentiated between demand and supply using examples
Lambiv
what is labour ?
Lambiv
how will I do?
Venny Reply
how is the graph works?I don't fully understand
Rezat Reply
information
Eliyee
devaluation
Eliyee
t
WARKISA
hi guys good evening to all
Lambiv
multiple choice question
Aster Reply
appreciation
Eliyee
explain perfect market
Lindiwe Reply
In economics, a perfect market refers to a theoretical construct where all participants have perfect information, goods are homogenous, there are no barriers to entry or exit, and prices are determined solely by supply and demand. It's an idealized model used for analysis,
Ezea
What is ceteris paribus?
Shukri Reply
other things being equal
AI-Robot
When MP₁ becomes negative, TP start to decline. Extuples Suppose that the short-run production function of certain cut-flower firm is given by: Q=4KL-0.6K2 - 0.112 • Where is quantity of cut flower produced, I is labour input and K is fixed capital input (K-5). Determine the average product of lab
Kelo
Extuples Suppose that the short-run production function of certain cut-flower firm is given by: Q=4KL-0.6K2 - 0.112 • Where is quantity of cut flower produced, I is labour input and K is fixed capital input (K-5). Determine the average product of labour (APL) and marginal product of labour (MPL)
Kelo
yes,thank you
Shukri
Can I ask you other question?
Shukri
what is monopoly mean?
Habtamu Reply
What is different between quantity demand and demand?
Shukri Reply
Quantity demanded refers to the specific amount of a good or service that consumers are willing and able to purchase at a give price and within a specific time period. Demand, on the other hand, is a broader concept that encompasses the entire relationship between price and quantity demanded
Ezea
ok
Shukri
how do you save a country economic situation when it's falling apart
Lilia Reply
what is the difference between economic growth and development
Fiker Reply
Economic growth as an increase in the production and consumption of goods and services within an economy.but Economic development as a broader concept that encompasses not only economic growth but also social & human well being.
Shukri
production function means
Jabir
What do you think is more important to focus on when considering inequality ?
Abdisa Reply
any question about economics?
Awais Reply
sir...I just want to ask one question... Define the term contract curve? if you are free please help me to find this answer 🙏
Asui
it is a curve that we get after connecting the pareto optimal combinations of two consumers after their mutually beneficial trade offs
Awais
thank you so much 👍 sir
Asui
In economics, the contract curve refers to the set of points in an Edgeworth box diagram where both parties involved in a trade cannot be made better off without making one of them worse off. It represents the Pareto efficient allocations of goods between two individuals or entities, where neither p
Cornelius
In economics, the contract curve refers to the set of points in an Edgeworth box diagram where both parties involved in a trade cannot be made better off without making one of them worse off. It represents the Pareto efficient allocations of goods between two individuals or entities,
Cornelius
Suppose a consumer consuming two commodities X and Y has The following utility function u=X0.4 Y0.6. If the price of the X and Y are 2 and 3 respectively and income Constraint is birr 50. A,Calculate quantities of x and y which maximize utility. B,Calculate value of Lagrange multiplier. C,Calculate quantities of X and Y consumed with a given price. D,alculate optimum level of output .
Feyisa Reply
Answer
Feyisa
c
Jabir
Got questions? Join the online conversation and get instant answers!
Jobilize.com Reply

Get Jobilize Job Search Mobile App in your pocket Now!

Get it on Google Play Download on the App Store Now


Source:  OpenStax, Physics - grade 10 [caps 2011]. OpenStax CNX. Jun 14, 2011 Download for free at http://cnx.org/content/col11298/1.3
Google Play and the Google Play logo are trademarks of Google Inc.

Notification Switch

Would you like to follow the 'Physics - grade 10 [caps 2011]' conversation and receive update notifications?

Ask