

| << Chapter < Page | Chapter >> Page > |
We apply this Problem-Solving Strategy to compute a limit in [link] .
Evaluate using a table of functional values.
We have calculated the values of for the values of x listed in [link] .
| x | x | |||
|---|---|---|---|---|
| −0.1 | 0.998334166468 | 0.1 | 0.998334166468 | |
| −0.01 | 0.999983333417 | 0.01 | 0.999983333417 | |
| −0.001 | 0.999999833333 | 0.001 | 0.999999833333 | |
| −0.0001 | 0.999999998333 | 0.0001 | 0.999999998333 |
Note : The values in this table were obtained using a calculator and using all the places given in the calculator output.
As we read down each column, we see that the values in each column appear to be approaching one. Thus, it is fairly reasonable to conclude that A calculator-or computer-generated graph of would be similar to that shown in [link] , and it confirms our estimate.
![A graph of f(x) = sin(x)/x over the interval [-6, 6]. The curving function has a y intercept at x=0 and x intercepts at y=pi and y=-pi.](/ocw/mirror/col11964/m53491/CNX_Calc_Figure_02_02_003.jpg)
Evaluate using a table of functional values.
As before, we use a table—in this case, [link] —to list the values of the function for the given values of x .
| x | x | |||
|---|---|---|---|---|
| 3.9 | 0.251582341869 | 4.1 | 0.248456731317 | |
| 3.99 | 0.25015644562 | 4.01 | 0.24984394501 | |
| 3.999 | 0.250015627 | 4.001 | 0.249984377 | |
| 3.9999 | 0.250001563 | 4.0001 | 0.249998438 | |
| 3.99999 | 0.25000016 | 4.00001 | 0.24999984 |
After inspecting this table, we see that the functional values less than 4 appear to be decreasing toward 0.25 whereas the functional values greater than 4 appear to be increasing toward 0.25. We conclude that We confirm this estimate using the graph of shown in [link] .
![A graph of the function f(x) = (sqrt(x) – 2 ) / (x-4) over the interval [0,8]. There is an open circle on the function at x=4. The function curves asymptotically towards the x axis and y axis in quadrant one.](/ocw/mirror/col11964/m53491/CNX_Calc_Figure_02_02_004.jpg)
Estimate using a table of functional values. Use a graph to confirm your estimate.
At this point, we see from [link] and [link] that it may be just as easy, if not easier, to estimate a limit of a function by inspecting its graph as it is to estimate the limit by using a table of functional values. In [link] , we evaluate a limit exclusively by looking at a graph rather than by using a table of functional values.
For shown in [link] , evaluate
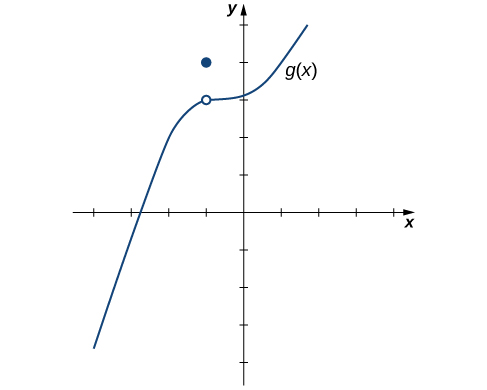
Despite the fact that as the x -values approach −1 from either side, the values approach 3. Therefore, Note that we can determine this limit without even knowing the algebraic expression of the function.
Based on [link] , we make the following observation: It is possible for the limit of a function to exist at a point, and for the function to be defined at this point, but the limit of the function and the value of the function at the point may be different.
Looking at a table of functional values or looking at the graph of a function provides us with useful insight into the value of the limit of a function at a given point. However, these techniques rely too much on guesswork. We eventually need to develop alternative methods of evaluating limits. These new methods are more algebraic in nature and we explore them in the next section; however, at this point we introduce two special limits that are foundational to the techniques to come.
Notification Switch
Would you like to follow the 'Calculus volume 1' conversation and receive update notifications?

|
|

|
|

|
|

|
|

|
|

|
|

|
|

|
|

|
|

|
![A graph of the function h(x), which is a parabola graphed over [-2.5, 5]. There is an open circle where the vertex should be at the point (2,-1).](/ocw/mirror/col11964/m53491/CNX_Calc_Figure_02_02_007.jpg)