<< Chapter < Page Chapter >> Page >

As we mentioned in The Spectra of Stars (and Brown Dwarfs) section, astronomers use the term “metals” to refer to all elements heavier than hydrogen and helium. The fraction of a star’s mass that is composed of these elements is referred to as the star’s metallicity . The metallicity of the Sun, for example, is 0.02, since 2% of the Sun’s mass is made of elements heavier than helium.

Appendix K lists how common each element is in the universe (compared to hydrogen); these estimates are based primarily on investigation of the Sun, which is a typical star. Some very rare elements, however, have not been detected in the Sun. Estimates of the amounts of these elements in the universe are based on laboratory measurements of their abundance in primitive meteorites, which are considered representative of unaltered material condensed from the solar nebula (see the Cosmic Samples and the Origin of the Solar System chapter).

Radial velocity

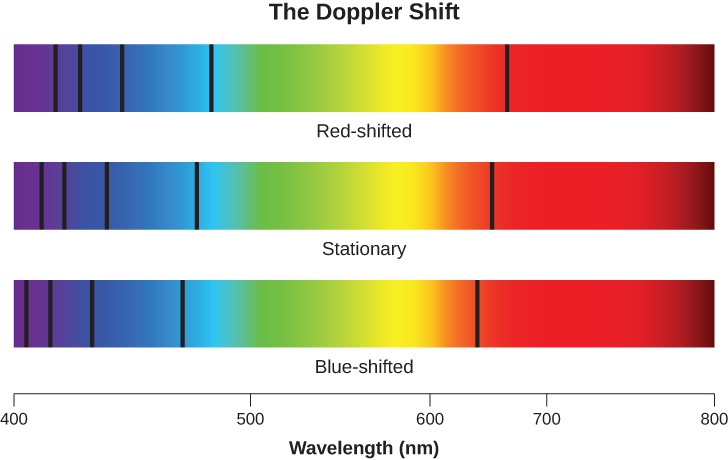
When we measure the spectrum of a star, we determine the wavelength of each of its lines. If the star is not moving with respect to the Sun, then the wavelength corresponding to each element will be the same as those we measure in a laboratory here on Earth. But if stars are moving toward or away from us, we must consider the Doppler effect (see The Doppler Effect section). We should see all the spectral lines of moving stars shifted toward the red end of the spectrum if the star is moving away from us, or toward the blue (violet) end if it is moving toward us ( [link] ). The greater the shift, the faster the star is moving. Such motion, along the line of sight between the star and the observer, is called radial velocity    and is usually measured in kilometers per second.

Doppler-shifted stars.

Diagram illustrating the Doppler Shift. At bottom is the wavelength scale in nanometers (nm), starting at 400 nm on the left and progressing to 750 nm at right. Above the scale are three spectra, one above the other. The spectrum in the center shows a stationary object, with five hypothetical spectral lines shown at their rest positions. At top red-shift is illustrated with the same five lines each equally moved slightly to the right, or to the red part of the spectrum. At bottom blue-shift is illustrated with the same five lines each equally moved slightly to the left, or to the blue part of the spectrum. This image is for illustrative purposes, and no exact red- or blue-shift value is given.
When the spectral lines of a moving star shift toward the red end of the spectrum, we know that the star is moving away from us. If they shift toward the blue end, the star is moving toward us.

William Huggins , pioneering yet again, in 1868 made the first radial velocity determination of a star. He observed the Doppler shift in one of the hydrogen lines in the spectrum of Sirius and found that this star is moving toward the solar system. Today, radial velocity can be measured for any star bright enough for its spectrum to be observed. As we will see in The Stars: A Celestial Census , radial velocity measurements of double stars are crucial in deriving stellar masses.

Proper motion

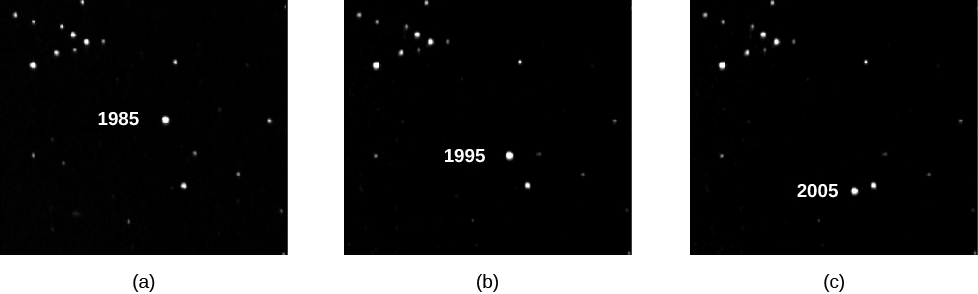
There is another type of motion stars can have that cannot be detected with stellar spectra. Unlike radial motion, which is along our line of sight (i.e., toward or away from Earth), this motion, called proper motion    , is transverse : that is, across our line of sight. We see it as a change in the relative positions of the stars on the celestial sphere ( [link] ). These changes are very slow. Even the star with the largest proper motion takes 200 years to change its position in the sky by an amount equal to the width of the full Moon, and the motions of other stars are smaller yet.

Large proper motion.

Photographs of Barnard’s Star demonstrating its large proper motion. At left (a) the star is seen in the center of an image taken in 1985, along with several background stars. At center (b) is the same field as photographed in 1995. The background stars have not moved, but Barnard’s Star has moved downward from the center of the image (where is was seen in 1985). At right (c) is the same field in 2005. The background stars have again not moved, and Barnard’s Star is now near the bottom of the image.
Three photographs of Barnard’s star, the star with the largest known proper motion, show how this faint star has moved over a period of 20 years. (modification of work by Steve Quirk)

Questions & Answers

What is inflation
Bright Reply
a general and ongoing rise in the level of prices in an economy
AI-Robot
What are the factors that affect demand for a commodity
Florence Reply
price
Kenu
differentiate between demand and supply giving examples
Lambiv Reply
differentiated between demand and supply using examples
Lambiv
what is labour ?
Lambiv
how will I do?
Venny Reply
how is the graph works?I don't fully understand
Rezat Reply
information
Eliyee
devaluation
Eliyee
t
WARKISA
hi guys good evening to all
Lambiv
multiple choice question
Aster Reply
appreciation
Eliyee
explain perfect market
Lindiwe Reply
In economics, a perfect market refers to a theoretical construct where all participants have perfect information, goods are homogenous, there are no barriers to entry or exit, and prices are determined solely by supply and demand. It's an idealized model used for analysis,
Ezea
What is ceteris paribus?
Shukri Reply
other things being equal
AI-Robot
When MP₁ becomes negative, TP start to decline. Extuples Suppose that the short-run production function of certain cut-flower firm is given by: Q=4KL-0.6K2 - 0.112 • Where is quantity of cut flower produced, I is labour input and K is fixed capital input (K-5). Determine the average product of lab
Kelo
Extuples Suppose that the short-run production function of certain cut-flower firm is given by: Q=4KL-0.6K2 - 0.112 • Where is quantity of cut flower produced, I is labour input and K is fixed capital input (K-5). Determine the average product of labour (APL) and marginal product of labour (MPL)
Kelo
yes,thank you
Shukri
Can I ask you other question?
Shukri
what is monopoly mean?
Habtamu Reply
What is different between quantity demand and demand?
Shukri Reply
Quantity demanded refers to the specific amount of a good or service that consumers are willing and able to purchase at a give price and within a specific time period. Demand, on the other hand, is a broader concept that encompasses the entire relationship between price and quantity demanded
Ezea
ok
Shukri
how do you save a country economic situation when it's falling apart
Lilia Reply
what is the difference between economic growth and development
Fiker Reply
Economic growth as an increase in the production and consumption of goods and services within an economy.but Economic development as a broader concept that encompasses not only economic growth but also social & human well being.
Shukri
production function means
Jabir
What do you think is more important to focus on when considering inequality ?
Abdisa Reply
any question about economics?
Awais Reply
sir...I just want to ask one question... Define the term contract curve? if you are free please help me to find this answer 🙏
Asui
it is a curve that we get after connecting the pareto optimal combinations of two consumers after their mutually beneficial trade offs
Awais
thank you so much 👍 sir
Asui
In economics, the contract curve refers to the set of points in an Edgeworth box diagram where both parties involved in a trade cannot be made better off without making one of them worse off. It represents the Pareto efficient allocations of goods between two individuals or entities, where neither p
Cornelius
In economics, the contract curve refers to the set of points in an Edgeworth box diagram where both parties involved in a trade cannot be made better off without making one of them worse off. It represents the Pareto efficient allocations of goods between two individuals or entities,
Cornelius
Suppose a consumer consuming two commodities X and Y has The following utility function u=X0.4 Y0.6. If the price of the X and Y are 2 and 3 respectively and income Constraint is birr 50. A,Calculate quantities of x and y which maximize utility. B,Calculate value of Lagrange multiplier. C,Calculate quantities of X and Y consumed with a given price. D,alculate optimum level of output .
Feyisa Reply
Answer
Feyisa
c
Jabir
Got questions? Join the online conversation and get instant answers!
Jobilize.com Reply

Get Jobilize Job Search Mobile App in your pocket Now!

Get it on Google Play Download on the App Store Now


Source:  OpenStax, Astronomy. OpenStax CNX. Apr 12, 2017 Download for free at http://cnx.org/content/col11992/1.13
Google Play and the Google Play logo are trademarks of Google Inc.

Notification Switch

Would you like to follow the 'Astronomy' conversation and receive update notifications?

Ask