

| << Chapter < Page | Chapter >> Page > |
By the end of this section, you will be able to:
The atmosphere s of the jovian planets are the parts we can observe or measure directly. Since these planets have no solid surfaces, their atmospheres are more representative of their general compositions than is the case with the terrestrial planets. These atmospheres also present us with some of the most dramatic examples of weather patterns in the solar system. As we will see, storms on these planets can grow bigger than the entire planet Earth.
When sunlight reflects from the atmospheres of the giant planets, the atmospheric gases leave their “fingerprints” in the spectrum of light. Spectroscopic observations of the jovian planets began in the nineteenth century, but for a long time, astronomers were not able to interpret the spectra they observed. As late as the 1930s, the most prominent features photographed in these spectra remained unidentified. Then better spectra revealed the presence of molecules of methane (CH 4 ) and ammonia (NH 3 ) in the atmospheres of Jupiter and Saturn.
At first astronomers thought that methane and ammonia might be the main constituents of these atmospheres, but now we know that hydrogen and helium are actually the dominant gases. The confusion arose because neither hydrogen nor helium possesses easily detected spectral features in the visible spectrum. It was not until the Voyager spacecraft measured the far-infrared spectra of Jupiter and Saturn that a reliable abundance for the elusive helium could be found.
The compositions of the two atmospheres are generally similar, except that on Saturn there is less helium as the result of the precipitation of helium that contributes to Saturn’s internal energy source. The most precise measurements of composition were made on Jupiter by the Galileo entry probe in 1995; as a result, we know the abundances of some elements in the jovian atmosphere even better than we know those in the Sun.
The career of physicist James Van Allen spanned the birth and growth of the space age, and he played a major role in its development. Born in Iowa in 1914, Van Allen received his PhD from the University of Iowa. He then worked for several research institutions and served in the Navy during World War II.
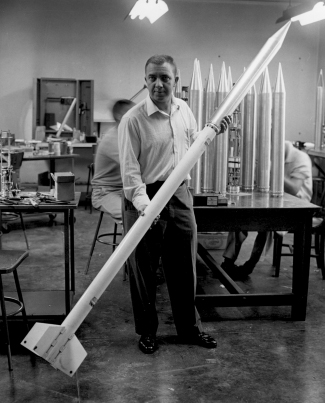
After the war, Van Allen ( [link] ) was appointed Professor of Physics at the University of Iowa. He and his collaborators began using rockets to explore cosmic radiation in Earth’s outer atmosphere. To reach extremely high altitudes, Van Allen designed a technique in which a balloon lifts and then launches a small rocket (the rocket is nicknamed “the rockoon”).
Over dinner one night in 1950, Van Allen and several colleagues came up with the idea of the International Geophysical Year (IGY), an opportunity for scientists around the world to coordinate their investigations of the physics of Earth, especially research done at high altitudes. In 1955, the United States and the Soviet Union each committed themselves to launching an Earth-orbiting satellite during IGY, a competition that began what came to be known as the space race. The IGY (stretched to 18 months) took place between July 1957 and December 1958.
The Soviet Union won the first lap of the race by launching Sputnik 1 in October 1957. The US government spurred its scientists and engineers to even greater efforts to get something into space to maintain the country’s prestige. However, the primary US satellite program, Vanguard, ran into difficulties: each of its early launches crashed or exploded. Simultaneously, a second team of rocket engineers and scientists had quietly been working on a military launch vehicle called Jupiter-C. Van Allen spearheaded the design of the instruments aboard a small satellite that this vehicle would carry. On January 31, 1958, Van Allen’s Explorer 1 became the first US satellite in space.
Unlike Sputnik, Explorer 1 was equipped to make scientific measurements of high-energy charged particles above the atmosphere. Van Allen and his team discovered a belt of highly charged particles surrounding Earth, and these belts now bear his name. This first scientific discovery of the space program made Van Allen’s name known around the world.
Van Allen and his colleagues continued to measure the magnetic and particle environment around planets with increasingly sophisticated spacecraft, including Pioneers 10 and 11, which made exploratory surveys of the environments of Jupiter and Saturn. Some scientists refer to the charged-particle zones around those planets as Van Allen belt s as well. (Once, when Van Allen was giving a lecture at the University of Arizona, the graduate students in planetary science asked him if he would leave his belt at the school. It is now proudly displayed as the university’s “Van Allen belt.”)
Van Allen was a strong supporter of space science and an eloquent senior spokesperson for the American scientific community, warning NASA not to put all its efforts into human spaceflight, but to also use robotic spacecraft as productive tools for space exploration.
Notification Switch
Would you like to follow the 'Astronomy' conversation and receive update notifications?

|
|

|
|

|
|

|
|
|
|
|

|
|

|
|

|
|

|
|

|