This module introduces tree diagrams as a method for making some probability problems easier to solve. This module is included in the Elementary Statistics textbook/collection as an optional lesson.
A
tree diagram is a special type of graph used to determine the outcomes of an experiment. It consists of "branches" that are labeled with either frequencies or probabilities. Tree diagrams can make some probability problems easier to visualize and solve. The following example illustrates how to use a tree diagram.
In an urn, there are 11 balls. Three balls are red (
) and 8 balls are blue (
). Draw two balls, one at a time,
with replacement . "With replacement" means that you put the first ball back in the urn before you select the second ball. The tree diagram using frequencies that show all the possible outcomes follows.
The first set of branches represents the first draw. The second set of branches represents the second draw. Each of the outcomes is distinct. In fact, we can list each red ball as
,
, and
and each blue ball as
,
,
,
,
,
,
, and
. Then the 9
outcomes can be written as:
The other outcomes are similar.
There are a total of 11 balls in the urn. Draw two balls, one at a time, and with replacement. There are
outcomes, the size of the
sample space .
List the 24
outcomes:
,
,
, ...
Using the tree diagram, calculate
.
Using the tree diagram, calculate
.
Using the tree diagram, calculate
.
Using the tree diagram, calculate
.
This problem is a conditional. The sample space has been reduced to those outcomes that already have a blue on the first draw. There are
possible outcomes (24
and 64
). Twenty-four of the 88 possible outcomes are
.
.
Using the tree diagram, calculate
.
Using the tree diagram, calculate
.
There are
outcomes that have
on the first draw (9
and 24
). The sample space is then
. Twenty-four of the 33 outcomes have
on the second draw. The probability is then
.
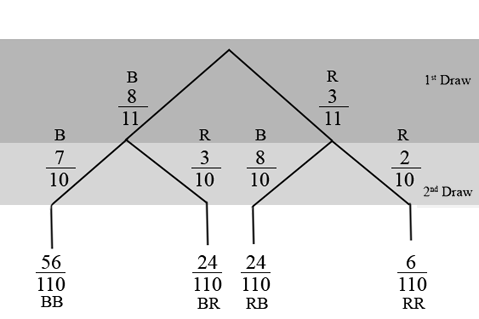
An urn has 3 red marbles and 8 blue marbles in it. Draw two marbles, one at a time, this time without replacement from the urn.
"Without replacement" means that you do not put the first ball back before you select the second ball. Below is a tree diagram. The branches are labeled with probabilities instead of frequencies. The numbers at the ends of the branches are calculated by multiplying the numbers on the two corresponding branches, for example,
.
If you draw a red on the first draw from the 3 red possibilities, there are 2 red left to draw on the second draw. You do not put back or replace the first ball after you have drawn it. You draw
without replacement , so that on the second draw there are 10 marbles left in the urn.
Calculate the following probabilities using the tree diagram.
=
Fill in the blanks:
=
Fill in the blanks:
=
=
There are
outcomes that have
on the first draw (6
and 24
). The 6 and the 24 are frequencies. They are also the numerators of the fractions
and
. The sample space is no longer 110 but
. Twenty-four of the 30 outcomes have
on the second draw. The probability is then
. Did you get this answer?
If we are using probabilities, we can label the tree in the following general way.
here means
here means
here means
here means
Questions & Answers
I'm interested in biological psychology and cognitive psychology
Communication is effective because it allows individuals to share ideas, thoughts, and information with others.
effective communication can lead to improved outcomes in various settings, including personal relationships, business environments, and educational settings. By communicating effectively, individuals can negotiate effectively, solve problems collaboratively, and work towards common goals.
it starts up serve and return practice/assessments.it helps find voice talking therapy also assessments through relaxed conversation.
miss
Every time someone flushes a toilet in the apartment building, the person begins to jumb back automatically after hearing the flush, before the water temperature changes. Identify the types of learning, if it is classical conditioning identify the NS, UCS, CS and CR. If it is operant conditioning, identify the type of consequence positive reinforcement, negative reinforcement or punishment
nature is an hereditary factor while nurture is an environmental factor which constitute an individual personality. so if an individual's parent has a deviant behavior and was also brought up in an deviant environment, observation of the behavior and the inborn trait we make the individual deviant.
Samuel
I am taking this course because I am hoping that I could somehow learn more about my chosen field of interest and due to the fact that being a PsyD really ignites my passion as an individual the more I hope to learn about developing and literally explore the complexity of my critical thinking skills
Receive real-time job alerts and never miss the right job again
Source:
OpenStax, Collaborative statistics using spreadsheets. OpenStax CNX. Jan 05, 2016 Download for free at http://legacy.cnx.org/content/col11521/1.23
Google Play and the Google Play logo are trademarks of Google Inc.
Notification Switch
Would you like to follow the 'Collaborative statistics using spreadsheets' conversation and receive update notifications?