<< Chapter < Page Chapter >> Page >
The figure includes a portion of the electromagnetic spectrum which extends from gamma radiation at the far left through x-ray, ultraviolet, visible, infrared, terahertz, and microwave to broadcast and wireless radio at the far right. At the top of the figure, inside a grey box, are three arrows. The first points left and is labeled, “Increasing energy E.” A second arrow is placed just below the first which also points left and is labeled, “Increasing frequency nu.” A third arrow is placed just below which points right and is labeled, “Increasing wavelength lambda.” Inside the grey box near the bottom is a blue sinusoidal wave pattern that moves horizontally through the box. At the far left end, the waves are short and tightly packed. They gradually lengthen moving left to right across the figure, resulting in significantly longer waves at the right end of the diagram. Beneath the grey box are a variety of photos aligned above the names of the radiation types and a numerical scale that is labeled, “Wavelength lambda ( m ).” This scale runs from 10 superscript negative 12 meters under gamma radiation increasing by powers of ten to a value of 10 superscript 3 meters at the far right under broadcast and wireless radio. X-ray appears around 10 superscript negative 10 meters, ultraviolet appears in the 10 superscript negative 8 to 10 superscript negative 7 range, visible light appears between 10 superscript negative 7 and 10 superscript negative 6, infrared appears in the 10 superscript negative 6 to 10 superscript negative 5 range, teraherz appears in the 10 superscript negative 4 to 10 superscript negative 3 range, microwave infrared appears in the 10 superscript negative 2 to 10 superscript negative 1 range, and broadcast and wireless radio extend from 10 to 10 superscript 3 meters. Labels above the scale are placed to indicate 1 n m at 10 superscript negative 9 meters, 1 micron at 10 superscript negative 6 meters, 1 millimeter at 10 superscript negative 3 meters, 1 centimeter at 10 superscript negative 2 meters, and 1 foot between 10 superscript negative 1 meter and 10 superscript 0 meters. A variety of images are placed beneath the grey box and above the scale in the figure to provide examples of related applications that use the electromagnetic radiation in the range of the scale beneath each image. The photos on the left above gamma radiation show cosmic rays and a multicolor PET scan image of a brain. A black and white x-ray image of a hand appears above x-rays. An image of a patient undergoing dental work, with a blue light being directed into the patient's mouth is labeled, “dental curing,” and is shown above ultraviolet radiation. Between the ultraviolet and infrared labels is a narrow band of violet, indigo, blue, green, yellow, orange, and red colors in narrow, vertical strips. From this narrow band, two dashed lines extend a short distance above to the left and right of an image of the visible spectrum. The image, which is labeled, “visible light,” is just a broader version of the narrow bands of color in the label area. Above infrared are images of a television remote and a black and green night vision image. At the left end of the microwave region, a satellite radar image is shown. Just right of this and still above the microwave region are images of a cell phone, a wireless router that is labeled, “wireless data,” and a microwave oven. Above broadcast and wireless radio are two images. The left most image is a black and white medical ultrasound image. A wireless AM radio is positioned at the far right in the image, also above broadcast and wireless radio.
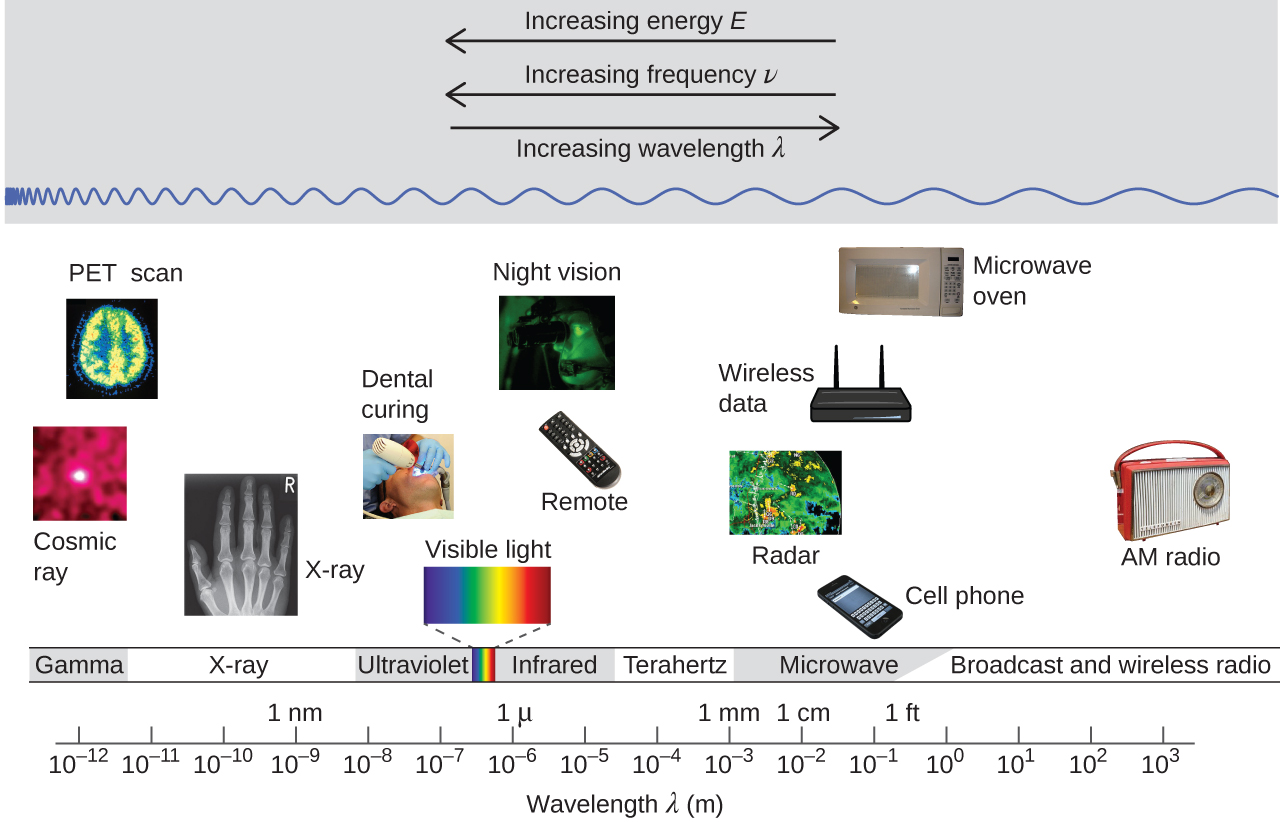
Portions of the electromagnetic spectrum are shown in order of decreasing frequency and increasing wavelength. Examples of some applications for various wavelengths include positron emission tomography (PET) scans, X-ray imaging, remote controls, wireless Internet, cellular telephones, and radios. (credit “Cosmic ray": modification of work by NASA; credit “PET scan": modification of work by the National Institute of Health; credit “X-ray": modification of work by Dr. Jochen Lengerke; credit “Dental curing": modification of work by the Department of the Navy; credit “Night vision": modification of work by the Department of the Army; credit “Remote": modification of work by Emilian Robert Vicol; credit “Cell phone": modification of work by Brett Jordan; credit “Microwave oven": modification of work by Billy Mabray; credit “Ultrasound": modification of work by Jane Whitney; credit “AM radio": modification of work by Dave Clausen)

Determining the frequency and wavelength of radiation

A sodium streetlight gives off yellow light that has a wavelength of 589 nm (1 nm = 1 × 10 −9 m). What is the frequency of this light?

Solution

We can rearrange the equation c = λν to solve for the frequency:

ν = c λ

Since c is expressed in meters per second, we must also convert 589 nm to meters.

ν = ( 2.998 × 10 8 m s −1 589 nm ) ( 1 × 10 9 nm 1 m ) = 5.09 × 10 14 s −1

Check your learning

One of the frequencies used to transmit and receive cellular telephone signals in the United States is 850 MHz. What is the wavelength in meters of these radio waves?

Answer:

0.353 m = 35.3 cm

Got questions? Get instant answers now!

Wireless communication

This figure consists of three cell phone tower images. The first involves a structure that uses a significant degree of scaffolding. The second image includes a tower with what appears to be a base that is essentially a large pole that branches out at the very top. The third image shows a cell phone tower that appears to be disguised as a palm tree.
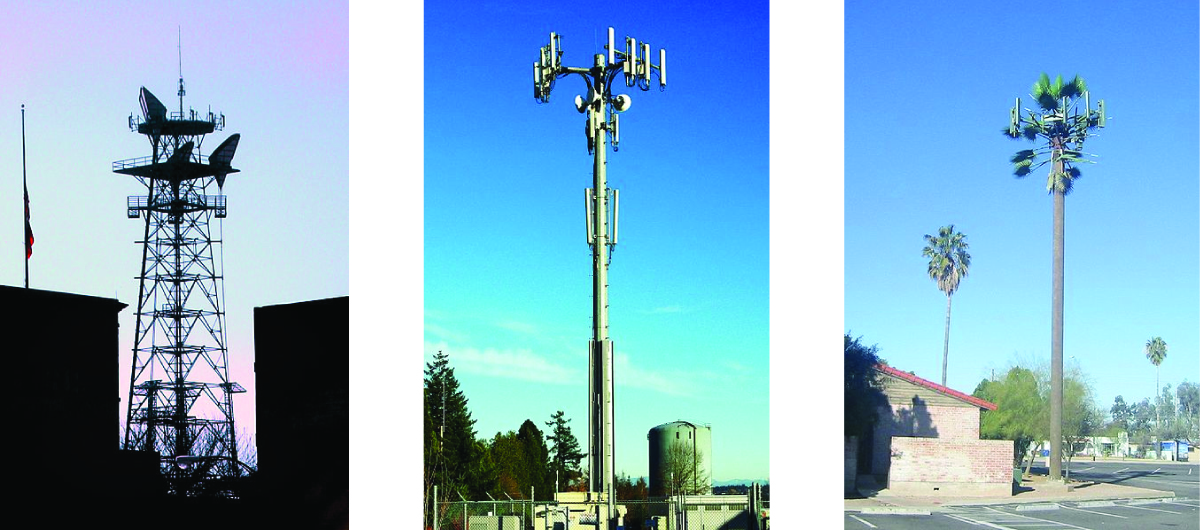
Radio and cell towers are typically used to transmit long-wavelength electromagnetic radiation. Increasingly, cell towers are designed to blend in with the landscape, as with the Tucson, Arizona, cell tower (right) disguised as a palm tree. (credit left: modification of work by Sir Mildred Pierce; credit middle: modification of work by M.O. Stevens)

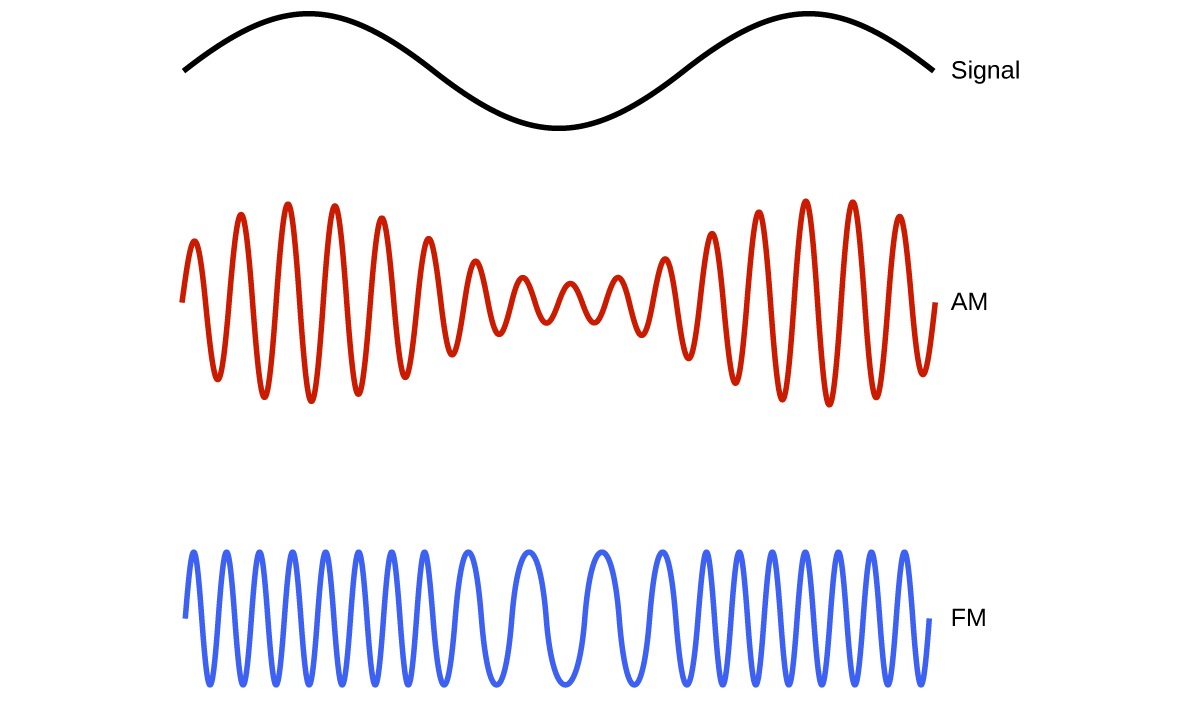
Many valuable technologies operate in the radio (3 kHz-300 GHz) frequency region of the electromagnetic spectrum. At the low frequency (low energy, long wavelength) end of this region are AM (amplitude modulation) radio signals (540-2830 kHz) that can travel long distances. FM (frequency modulation) radio signals are used at higher frequencies (87.5-108.0 MHz). In AM radio, the information is transmitted by varying the amplitude of the wave ( [link] ). In FM radio, by contrast, the amplitude is constant and the instantaneous frequency varies.

This figure shows 3 wave diagrams. The first wave diagram is in black and shows two crests, indicates a consistent distance from peak to trough, and has one trough in its span across the page. The label, “Signal,” appears to the right. Just below this, a wave diagram is shown in red. The wave includes sixteen crests, but the distance from the peaks to troughs of consecutive waves varies moving across the page. The peak to trough distance is greatest in the region below the peaks of the black wave diagram, and the distance from peak to trough is similarly least below the trough of the black wave diagram. This red wave diagram is labeled, “A M.” The third wave diagram is shown in blue. The distance from peak to trough of consecutive waves is constant across the page, but the peaks and troughs are more closely packed in the region below the peaks of the black wave diagram at the top of the figure. The peaks and troughs are relatively widely spaced below the trough region of the black wave diagram. This blue wave diagram is labeled “F M.”
This schematic depicts how amplitude modulation (AM) and frequency modulation (FM) can be used to transmit a radio wave.

Other technologies also operate in the radio-wave portion of the electromagnetic spectrum. For example, 4G cellular telephone signals are approximately 880 MHz, while Global Positioning System (GPS) signals operate at 1.228 and 1.575 GHz, local area wireless technology (Wi-Fi) networks operate at 2.4 to 5 GHz, and highway toll sensors operate at 5.8 GHz. The frequencies associated with these applications are convenient because such waves tend not to be absorbed much by common building materials.

Questions & Answers

What is inflation
Bright Reply
a general and ongoing rise in the level of prices in an economy
AI-Robot
What are the factors that affect demand for a commodity
Florence Reply
price
Kenu
differentiate between demand and supply giving examples
Lambiv Reply
differentiated between demand and supply using examples
Lambiv
what is labour ?
Lambiv
how will I do?
Venny Reply
how is the graph works?I don't fully understand
Rezat Reply
information
Eliyee
devaluation
Eliyee
t
WARKISA
hi guys good evening to all
Lambiv
multiple choice question
Aster Reply
appreciation
Eliyee
explain perfect market
Lindiwe Reply
In economics, a perfect market refers to a theoretical construct where all participants have perfect information, goods are homogenous, there are no barriers to entry or exit, and prices are determined solely by supply and demand. It's an idealized model used for analysis,
Ezea
What is ceteris paribus?
Shukri Reply
other things being equal
AI-Robot
When MP₁ becomes negative, TP start to decline. Extuples Suppose that the short-run production function of certain cut-flower firm is given by: Q=4KL-0.6K2 - 0.112 • Where is quantity of cut flower produced, I is labour input and K is fixed capital input (K-5). Determine the average product of lab
Kelo
Extuples Suppose that the short-run production function of certain cut-flower firm is given by: Q=4KL-0.6K2 - 0.112 • Where is quantity of cut flower produced, I is labour input and K is fixed capital input (K-5). Determine the average product of labour (APL) and marginal product of labour (MPL)
Kelo
yes,thank you
Shukri
Can I ask you other question?
Shukri
what is monopoly mean?
Habtamu Reply
What is different between quantity demand and demand?
Shukri Reply
Quantity demanded refers to the specific amount of a good or service that consumers are willing and able to purchase at a give price and within a specific time period. Demand, on the other hand, is a broader concept that encompasses the entire relationship between price and quantity demanded
Ezea
ok
Shukri
how do you save a country economic situation when it's falling apart
Lilia Reply
what is the difference between economic growth and development
Fiker Reply
Economic growth as an increase in the production and consumption of goods and services within an economy.but Economic development as a broader concept that encompasses not only economic growth but also social & human well being.
Shukri
production function means
Jabir
What do you think is more important to focus on when considering inequality ?
Abdisa Reply
any question about economics?
Awais Reply
sir...I just want to ask one question... Define the term contract curve? if you are free please help me to find this answer 🙏
Asui
it is a curve that we get after connecting the pareto optimal combinations of two consumers after their mutually beneficial trade offs
Awais
thank you so much 👍 sir
Asui
In economics, the contract curve refers to the set of points in an Edgeworth box diagram where both parties involved in a trade cannot be made better off without making one of them worse off. It represents the Pareto efficient allocations of goods between two individuals or entities, where neither p
Cornelius
In economics, the contract curve refers to the set of points in an Edgeworth box diagram where both parties involved in a trade cannot be made better off without making one of them worse off. It represents the Pareto efficient allocations of goods between two individuals or entities,
Cornelius
Suppose a consumer consuming two commodities X and Y has The following utility function u=X0.4 Y0.6. If the price of the X and Y are 2 and 3 respectively and income Constraint is birr 50. A,Calculate quantities of x and y which maximize utility. B,Calculate value of Lagrange multiplier. C,Calculate quantities of X and Y consumed with a given price. D,alculate optimum level of output .
Feyisa Reply
Answer
Feyisa
c
Jabir
Got questions? Join the online conversation and get instant answers!
Jobilize.com Reply

Get Jobilize Job Search Mobile App in your pocket Now!

Get it on Google Play Download on the App Store Now


Source:  OpenStax, Ut austin - principles of chemistry. OpenStax CNX. Mar 31, 2016 Download for free at http://legacy.cnx.org/content/col11830/1.13
Google Play and the Google Play logo are trademarks of Google Inc.

Notification Switch

Would you like to follow the 'Ut austin - principles of chemistry' conversation and receive update notifications?

Ask