<< Chapter < Page Chapter >> Page >

Fourier transform infrared spectroscopy

Fourier transform infrared spectroscopy (FTIR) is the most popular spectroscopic method used for characterizing organic and inorganic compounds. The basic modification of an FTIR from a regular IR instrument is a device called interferometer, which generates a signal that allows very fast IR spectrum acquisition. For doing so, the generatated interferogram has to be “expanded” using a Fourier transformation to generate a complete IR frequency spectrum. In the case of performing FTIR transmission studies the intensity of the transmitted signal is measured and the IR fingerprint is generated [link] .

T = I I b = e cεl size 12{T= { {I} over {I rSub { size 8{b} } } } =e rSup { size 8{ ital "cel"} } } {}

Where I is the intensity of the samples, I b is the intensity of the background, c is the concentration of the compound, ε is the molar extinction coefficient and l is the distance that light travels through the material. A transformation of transmission to absorption spectra is usually performed and the actual concentration of the component can be calculated by applying the Beer-Lambert law [link] .

A = ln ( T ) = cεl size 12{A= - "ln" \( T \) = ital "cel"} {}

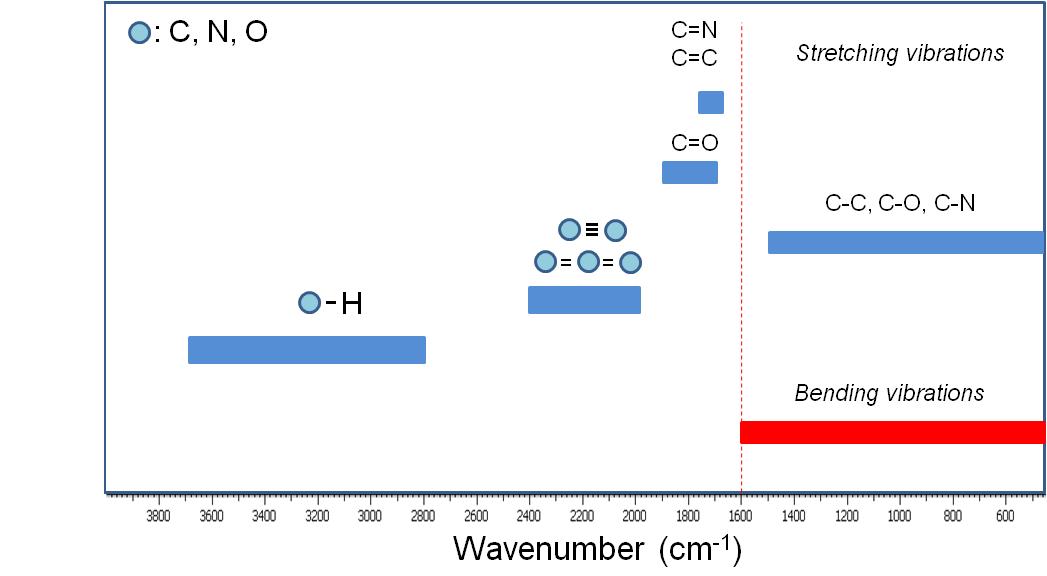
A qualitative IR-band map is presented in [link] . The absorption bands between 4000 to 1600 cm -1 represent the group frequency region and are used to identify the stretching vibrations of different bonds. At lower frequencies (from 1600 to 400 cm -1 ) vibrations due to intermolecular bond bending occurs upon IR excitation and therefore are usually not taken into account.

Selected FTIR stretching and bending modes associated with the typical ligands used for nanoparticle stabilization.

Tga/dsc–ftir characterization

TGA/DSC is a powerful tool for identifying the different compounds evolved during the controlled pyrolysis and therefore provide qualitative and quantitative information about the volatile components of the sample. In metal oxide nanoparticle synthesis TGA/DSC-FTIR studies can provide qualitative and quantitative information about the volatile compounds of the nanoparticles.

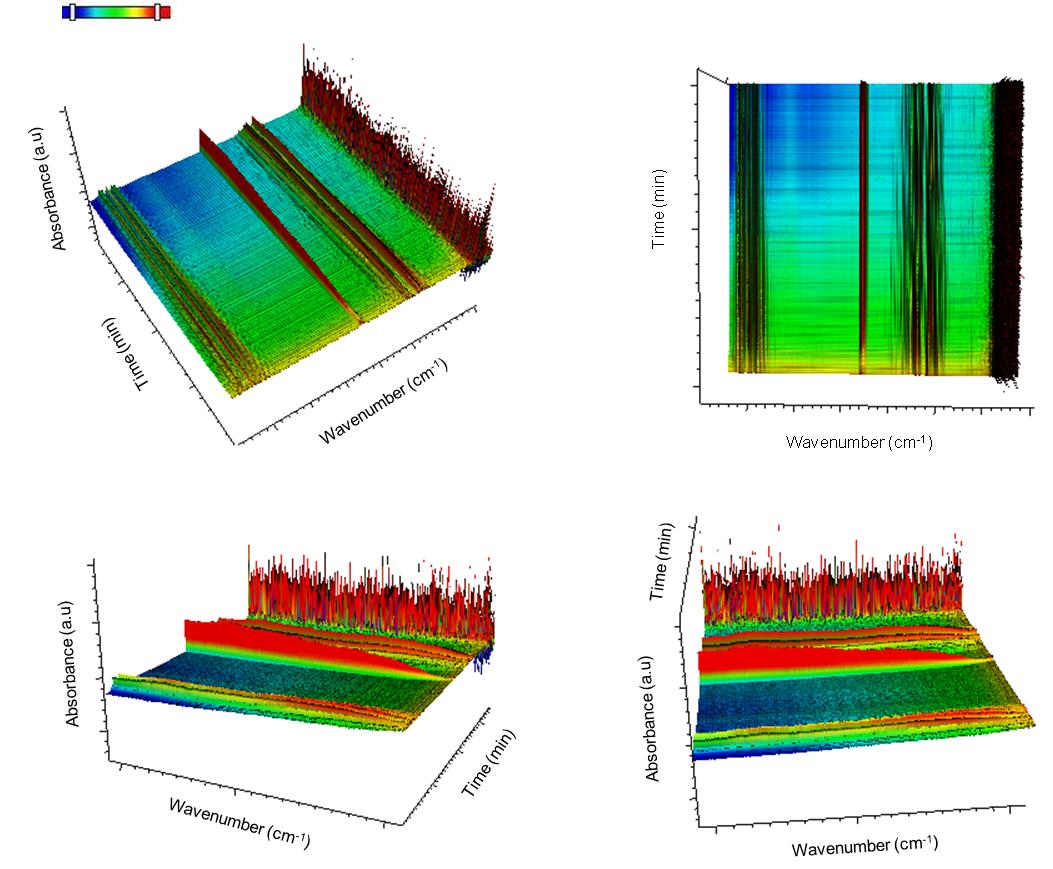
TGA–FTIR results presented below were acquired using a Q600 Simultaneous TGA/DSC (SDT) instrument online with a Nicolet 5700 FTIR spectrometer. This system has a digital mass flow control and two gas inlets giving the capability to switch reacting gas during each run. It allows simultaneous weight change and differential heat flow measurements up to 1500 °C, while at the same time the outflow line is connected to the FTIR for performing gas phase compound identification. Grand-Schmidt thermographs were usually constructed to present the species evolution with time in 3 dimensions.

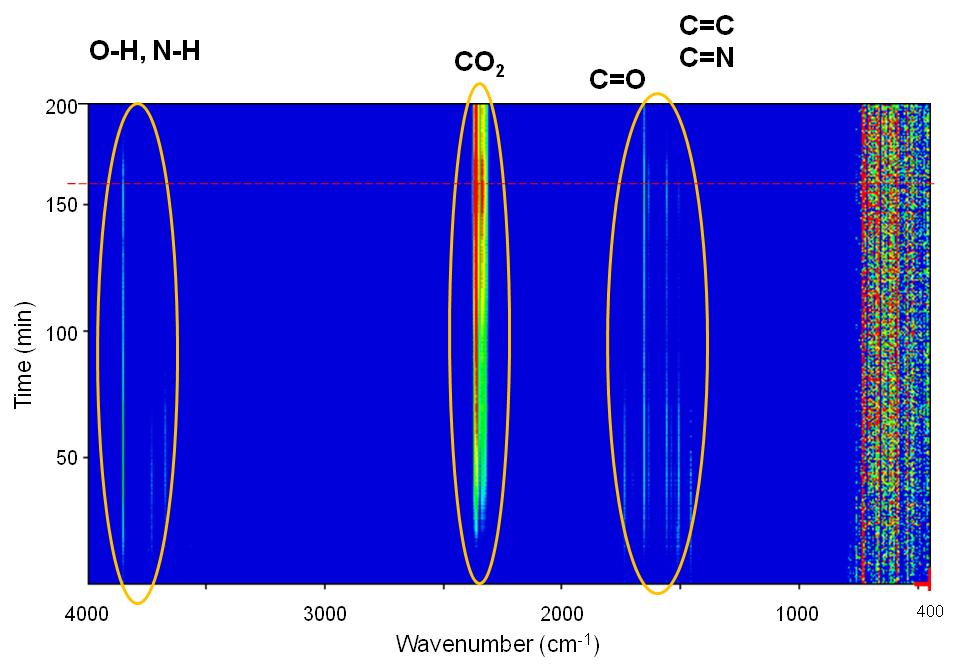
Selected IR spectra are presented in [link] . Four regions with intense peaks are observed. Between 4000 – 3550 cm -1 due to O-H bond stretching assigned to H 2 O that is always present and due to due to N-H group stretching that is assigned to the amine group of oleylamine. Between 2400 – 2250 cm -1 due to O=C=O stretching, between 1900 – 1400 cm -1 which is mainly to C=O stretching and between 800 – 400 cm -1 cannot be resolved as explained previously.

FTIR spectra of products from WO 3-x pyrolysis.

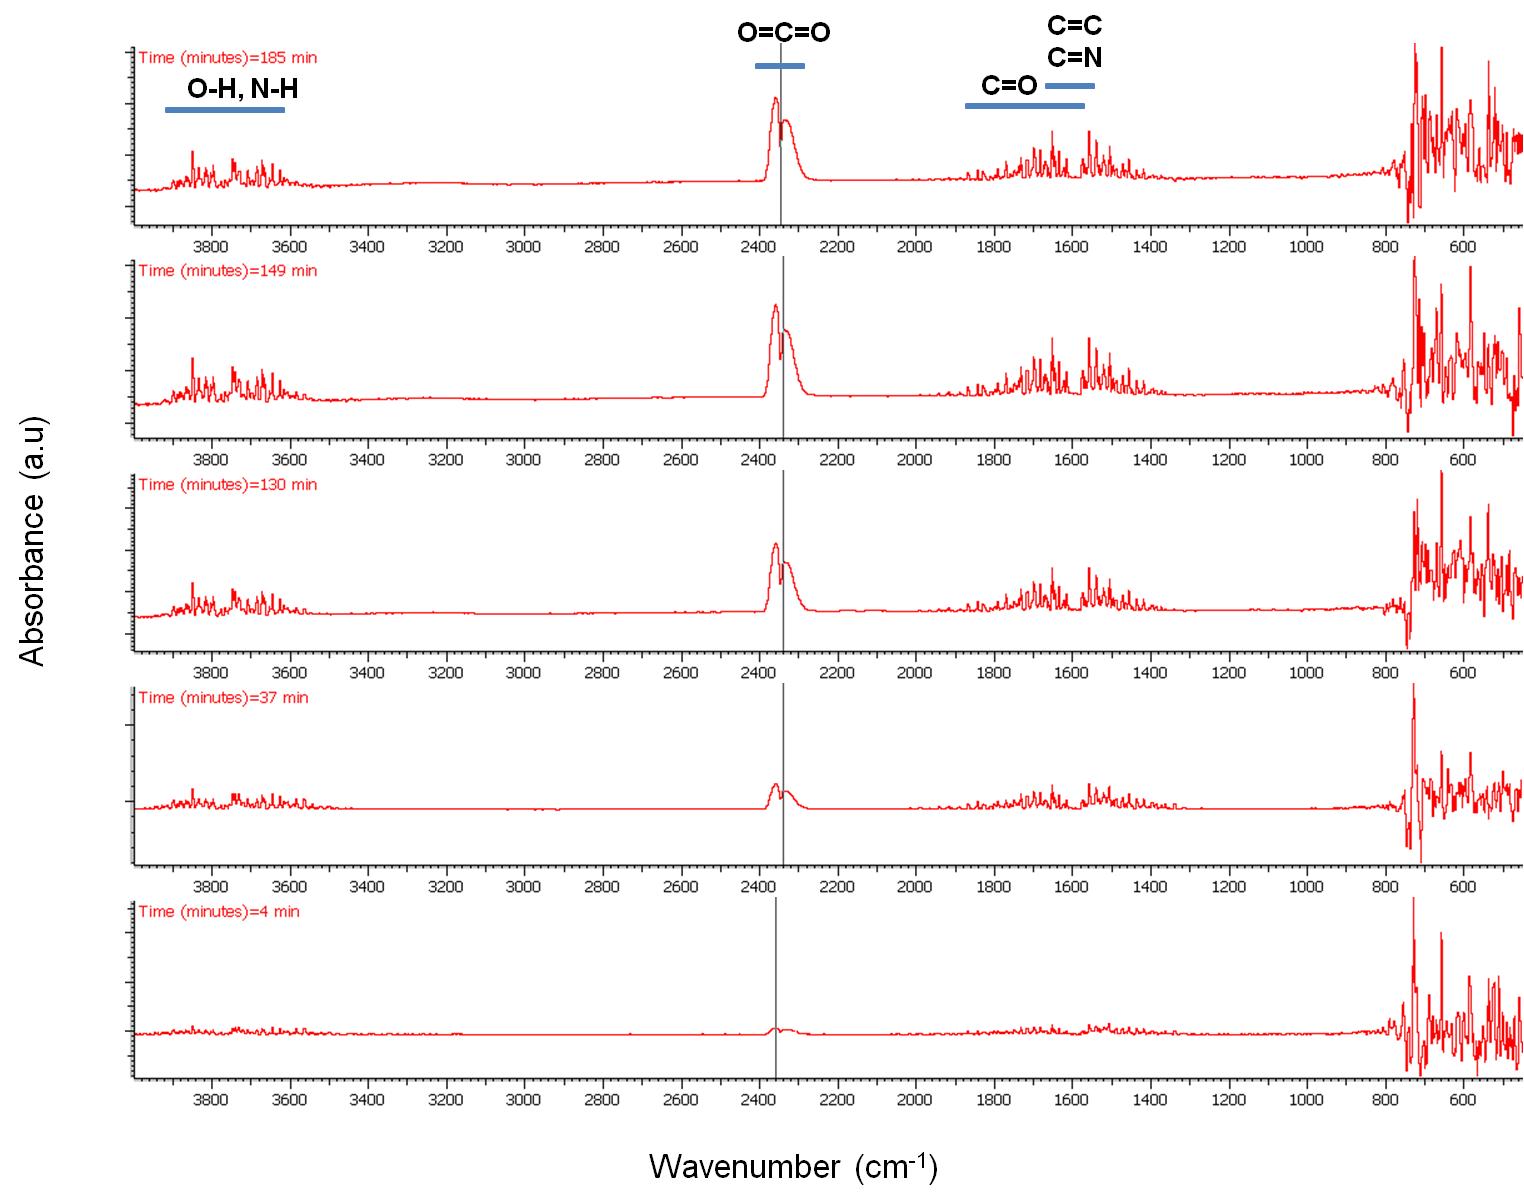
The peak intensity evolution with time can be more easily observed in [link] and [link] . As seen, CO 2 evolution increases significantly with time especially after switching our flow from N 2 to air. H 2 O seems to be present in the outflow stream up to 700 °C while the majority of the N-H amine peaks seem to disappear at about 75 min. C=N compounds are not expected to be present in the stream which leaves bands between 1900 – 1400 cm -1 assigned to C=C and C=O stretching vibrations. Unsaturated olefins resulting from the cracking of the oleylamine molecule are possible at elevated temperatures as well as the presence of CO especially under N 2 atmosphere.

3D representation of FTIR Spectra of the volatile compounds of WO 3-x .
Intensity profile of FTIR spectra of the volatile compounds formed from the pyrolysis of WO 3-x .

From the above compound identification we can summarize and propose the following applications for TGA-FTIR. First, more complex ligands, containing aromatic rings and maybe other functional groups may provide more insight in the ligand to MO x interaction. Second, the presence of CO and CO 2 even under N 2 flow means that complete O 2 removal from the TGA and the FTIR cannot be achieved under these conditions. Even though the system was equilibrated for more than an hour, traces of O 2 are existent which create errors in our calculations.

Bibliography

  • R. D. Parra and H. H. Farrell, J. Phys. Chem. C , 2009, 113 , 4786.
  • S. C. Vanithakumari and K. K. Nanda, J. Phys. Chem. B , 2006, 110 , 6985.
  • M. Wautelet and D. Duvivier, Eur. J. Phys. , 2007, 28 , 953.
  • X. Wang and Y. Li, J. Am. Chem. Soc. , 2002, 124 , 2880.
  • F. K. R. N. Greta and R. Patzke, Angew. Chem., Int. Ed. , 2002, 41 , 2446.
  • Z. W. Pan, Z. R. Dai, and Z. L. Wang, Science , 2001, 291 , 1947.
  • H. Gu and M. D. Soucek, Chem. Mater. , 2007, 19 , 1103.
  • L. M. Bronstein, X. Huang, J. Retrum, A. Schmucker, M. Pink, B. D. Stein, and B. Dragnea, Chem. Mater. , 2007, 19 , 3624.
  • D. Zitoun, N. Pinna, N. Frolet, and C. Belin, J. Am. Chem. Soc. , 2005, 127 , 15034.
  • S. -H. Choi, E. -G. Kim, J. Park, K. An, N. Lee, S. C. Kim, and T. Hyeon, J. Phys. Chem., B , 2005, 109 , 14792.
  • M. Epifani, J. Arbiol, R. Diaz, M. J. Peralvarez, P. Siciliano, and J. R. Morante, Chem. Mater. , 2005, 17 , 6468.
  • T. Yu, J. Joo, Y. I. Park, and T. Hyeon, J. Am. Chem. Soc. , 2006, 128 , 1786.
  • K. Lee, W. S. Seo, and J. T. Park, J. Am. Chem. Soc. , 2003, 125 , 3408.
  • C. A. Emeis, J. Catalysis , 1993, 141 , 347.
  • P. R. Griffiths, J. A. De Haseth, Fourier Transform Infrared Spectrometry . Wiley-Interscience, New York (2007)

Questions & Answers

A golfer on a fairway is 70 m away from the green, which sits below the level of the fairway by 20 m. If the golfer hits the ball at an angle of 40° with an initial speed of 20 m/s, how close to the green does she come?
Aislinn Reply
cm
tijani
what is titration
John Reply
what is physics
Siyaka Reply
A mouse of mass 200 g falls 100 m down a vertical mine shaft and lands at the bottom with a speed of 8.0 m/s. During its fall, how much work is done on the mouse by air resistance
Jude Reply
Can you compute that for me. Ty
Jude
what is the dimension formula of energy?
David Reply
what is viscosity?
David
what is inorganic
emma Reply
what is chemistry
Youesf Reply
what is inorganic
emma
Chemistry is a branch of science that deals with the study of matter,it composition,it structure and the changes it undergoes
Adjei
please, I'm a physics student and I need help in physics
Adjanou
chemistry could also be understood like the sexual attraction/repulsion of the male and female elements. the reaction varies depending on the energy differences of each given gender. + masculine -female.
Pedro
A ball is thrown straight up.it passes a 2.0m high window 7.50 m off the ground on it path up and takes 1.30 s to go past the window.what was the ball initial velocity
Krampah Reply
2. A sled plus passenger with total mass 50 kg is pulled 20 m across the snow (0.20) at constant velocity by a force directed 25° above the horizontal. Calculate (a) the work of the applied force, (b) the work of friction, and (c) the total work.
Sahid Reply
you have been hired as an espert witness in a court case involving an automobile accident. the accident involved car A of mass 1500kg which crashed into stationary car B of mass 1100kg. the driver of car A applied his brakes 15 m before he skidded and crashed into car B. after the collision, car A s
Samuel Reply
can someone explain to me, an ignorant high school student, why the trend of the graph doesn't follow the fact that the higher frequency a sound wave is, the more power it is, hence, making me think the phons output would follow this general trend?
Joseph Reply
Nevermind i just realied that the graph is the phons output for a person with normal hearing and not just the phons output of the sound waves power, I should read the entire thing next time
Joseph
Follow up question, does anyone know where I can find a graph that accuretly depicts the actual relative "power" output of sound over its frequency instead of just humans hearing
Joseph
"Generation of electrical energy from sound energy | IEEE Conference Publication | IEEE Xplore" ***ieeexplore.ieee.org/document/7150687?reload=true
Ryan
what's motion
Maurice Reply
what are the types of wave
Maurice
answer
Magreth
progressive wave
Magreth
hello friend how are you
Muhammad Reply
fine, how about you?
Mohammed
hi
Mujahid
A string is 3.00 m long with a mass of 5.00 g. The string is held taut with a tension of 500.00 N applied to the string. A pulse is sent down the string. How long does it take the pulse to travel the 3.00 m of the string?
yasuo Reply
Who can show me the full solution in this problem?
Reofrir Reply
Got questions? Join the online conversation and get instant answers!
Jobilize.com Reply

Get Jobilize Job Search Mobile App in your pocket Now!

Get it on Google Play Download on the App Store Now


Source:  OpenStax, Nanomaterials and nanotechnology. OpenStax CNX. May 07, 2014 Download for free at http://legacy.cnx.org/content/col10700/1.13
Google Play and the Google Play logo are trademarks of Google Inc.

Notification Switch

Would you like to follow the 'Nanomaterials and nanotechnology' conversation and receive update notifications?

Ask