<< Chapter < Page Chapter >> Page >

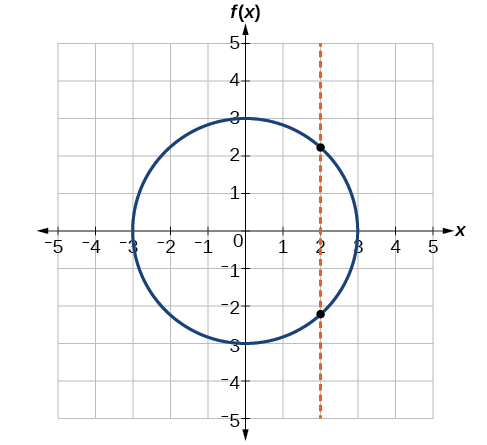
The most common graphs name the input value x and the output value y , and we say y is a function of x , or y = f ( x ) when the function is named f . The graph of the function is the set of all points ( x , y ) in the plane that satisfies the equation y = f ( x ) . If the function is defined for only a few input values, then the graph of the function consists of only a few points, where the x -coordinate of each point is an input value and the y -coordinate of each point is the corresponding output value. For example, the black dots on the graph in [link] tell us that f ( 0 ) = 2 and f ( 6 ) = 1. However, the set of all points ( x , y ) satisfying y = f ( x ) is a curve. The curve shown includes ( 0 , 2 ) and ( 6 , 1 ) because the curve passes through those points.

Graph of a polynomial.

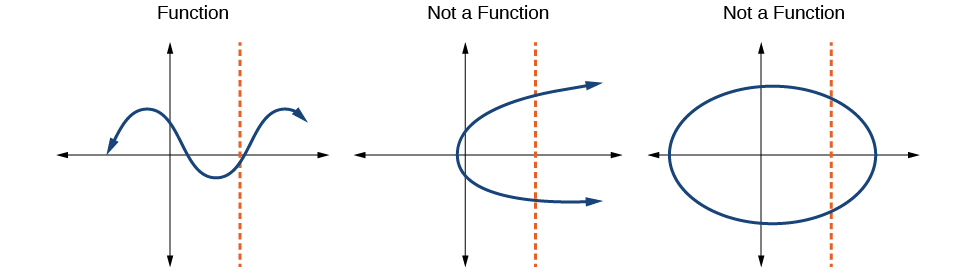
The vertical line test    can be used to determine whether a graph represents a function. If we can draw any vertical line that intersects a graph more than once, then the graph does not define a function because a function has only one output value for each input value. See [link] .

Three graphs visually showing what is and is not a function.

Given a graph, use the vertical line test to determine if the graph represents a function.

  1. Inspect the graph to see if any vertical line drawn would intersect the curve more than once.
  2. If there is any such line, determine that the graph does not represent a function.

Applying the vertical line test

Which of the graphs in [link] represent(s) a function y = f ( x ) ?

Graph of a polynomial.

If any vertical line intersects a graph more than once, the relation represented by the graph is not a function. Notice that any vertical line would pass through only one point of the two graphs shown in parts (a) and (b) of [link] . From this we can conclude that these two graphs represent functions. The third graph does not represent a function because, at most x -values, a vertical line would intersect the graph at more than one point, as shown in [link] .

Graph of a circle.
Got questions? Get instant answers now!

Does the graph in [link] represent a function?

Graph of absolute value function.

yes

Got questions? Get instant answers now!

Using the horizontal line test

Once we have determined that a graph defines a function, an easy way to determine if it is a one-to-one function is to use the horizontal line test    . Draw horizontal lines through the graph. If any horizontal line intersects the graph more than once, then the graph does not represent a one-to-one function.

Given a graph of a function, use the horizontal line test to determine if the graph represents a one-to-one function.

  1. Inspect the graph to see if any horizontal line drawn would intersect the curve more than once.
  2. If there is any such line, determine that the function is not one-to-one.

Applying the horizontal line test

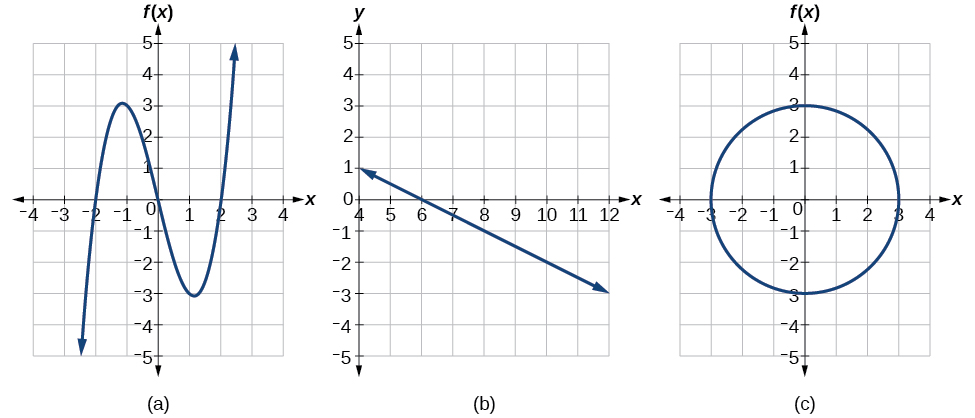
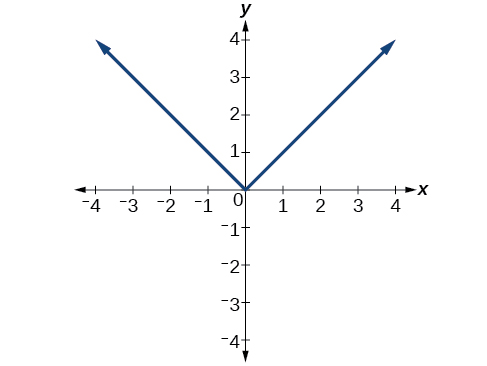
Consider the functions shown in [link] (a) and [link] (b) . Are either of the functions one-to-one?

The function in [link] (a) is not one-to-one. The horizontal line shown in [link] intersects the graph of the function at two points (and we can even find horizontal lines that intersect it at three points.)

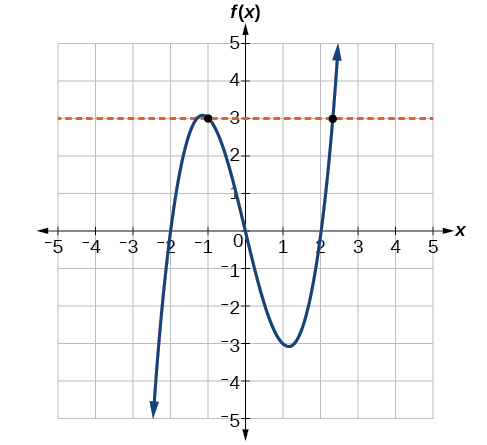
The function in [link] (b) is one-to-one. Any horizontal line will intersect a diagonal line at most once.

Got questions? Get instant answers now!

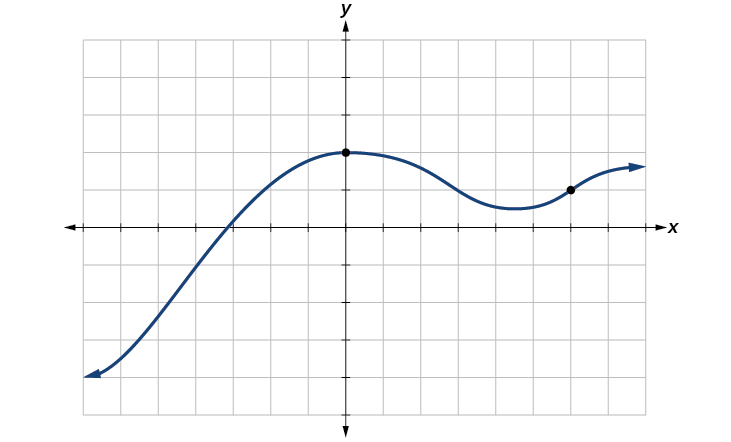
Is the graph shown in [link] one-to-one?

No, because it does not pass the horizontal line test.

Got questions? Get instant answers now!

Identifying basic toolkit functions

In this text, we will be exploring functions—the shapes of their graphs, their unique characteristics, their algebraic formulas, and how to solve problems with them. When learning to read, we start with the alphabet. When learning to do arithmetic, we start with numbers. When working with functions, it is similarly helpful to have a base set of building-block elements. We call these our “toolkit functions,” which form a set of basic named functions for which we know the graph, formula, and special properties. Some of these functions are programmed to individual buttons on many calculators. For these definitions we will use x as the input variable and y = f ( x ) as the output variable.

Questions & Answers

If c is the cost function for a particular product, find the marginal cost functions and their values at x=10 a. c(x) = 800+ 0.04x + 0.0002x² b. c(x) = 250 + 100x + 0.001x²
Mamush Reply
how can I find set theory
Ephraim Reply
how can I find set theory
Jarvis
is there an error on the one about the dime's thickness? says 2.2x10⁶=0.00135 m
Patrick Reply
hi, interested in algebra
Makan Reply
how to reduce an equation?
Makan
by manipulation of both side
Al
9(y+8)-27 is 9y+45. Why can't you reduce that to y+5? I know that's wrong but can't explain why
Patrick Reply
when you reduce an equation to its simplest terms, you can't change the value of the equation. reducing it to y + 5 is equivalent to dividing it by 9 which changes the value. you can multiply it by 1 or 9/9 which would give 9(y + 5). multiplying it by one does not change the value.
Philip
Given a polynomial expression, factor out the greatest common factor.
Hanu Reply
WHAT IS QUADRATIC EQUATION?
Charles Reply
WHAT IS SYSTEM OF LINEAR INEWUALITIES?
Charles
WHAT IS SYSTEM OF LINEAR INEWUALITIES?
Charles
complex perform
Angel
what is equation?
Charles Reply
what are equations?
Charles
Definition of economics according to karl Marx Thomas malthus Jeremy bentham David Ricardo J.K
Rakiya
Please help me is assignment
Rakiya
The 47th problem of Euclid
Kenneth
show that the set of all natural number form semi group under the composition of addition
Nikhil Reply
what is the meaning
Dominic
explain and give four Example hyperbolic function
Lukman Reply
_3_2_1
felecia
⅗ ⅔½
felecia
_½+⅔-¾
felecia
The denominator of a certain fraction is 9 more than the numerator. If 6 is added to both terms of the fraction, the value of the fraction becomes 2/3. Find the original fraction. 2. The sum of the least and greatest of 3 consecutive integers is 60. What are the valu
SABAL Reply
1. x + 6 2 -------------- = _ x + 9 + 6 3 x + 6 3 ----------- x -- (cross multiply) x + 15 2 3(x + 6) = 2(x + 15) 3x + 18 = 2x + 30 (-2x from both) x + 18 = 30 (-18 from both) x = 12 Test: 12 + 6 18 2 -------------- = --- = --- 12 + 9 + 6 27 3
Pawel
2. (x) + (x + 2) = 60 2x + 2 = 60 2x = 58 x = 29 29, 30, & 31
Pawel
ok
Ifeanyi
on number 2 question How did you got 2x +2
Ifeanyi
combine like terms. x + x + 2 is same as 2x + 2
Pawel
x*x=2
felecia
2+2x=
felecia
×/×+9+6/1
Debbie
Q2 x+(x+2)+(x+4)=60 3x+6=60 3x+6-6=60-6 3x=54 3x/3=54/3 x=18 :. The numbers are 18,20 and 22
Naagmenkoma
Mark and Don are planning to sell each of their marble collections at a garage sale. If Don has 1 more than 3 times the number of marbles Mark has, how many does each boy have to sell if the total number of marbles is 113?
mariel Reply
Mark = x,. Don = 3x + 1 x + 3x + 1 = 113 4x = 112, x = 28 Mark = 28, Don = 85, 28 + 85 = 113
Pawel
how do I set up the problem?
Harshika Reply
what is a solution set?
Harshika
find the subring of gaussian integers?
Rofiqul
hello, I am happy to help!
Shirley Reply
please can go further on polynomials quadratic
Abdullahi
hi mam
Mark
I need quadratic equation link to Alpa Beta
Abdullahi Reply

Get Jobilize Job Search Mobile App in your pocket Now!

Get it on Google Play Download on the App Store Now


Source:  OpenStax, College algebra. OpenStax CNX. Feb 06, 2015 Download for free at https://legacy.cnx.org/content/col11759/1.3
Google Play and the Google Play logo are trademarks of Google Inc.

Notification Switch

Would you like to follow the 'College algebra' conversation and receive update notifications?

Ask