<< Chapter < Page Chapter >> Page >

Finding increasing and decreasing intervals on a graph

Given the function p ( t ) in [link] , identify the intervals on which the function appears to be increasing.
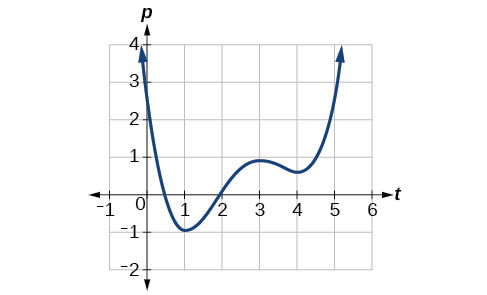
Graph of a polynomial.

We see that the function is not constant on any interval. The function is increasing where it slants upward as we move to the right and decreasing where it slants downward as we move to the right. The function appears to be increasing from t = 1 to t = 3 and from t = 4 on.

In interval notation    , we would say the function appears to be increasing on the interval (1,3) and the interval ( 4 , ) .

Got questions? Get instant answers now!

Finding local extrema from a graph

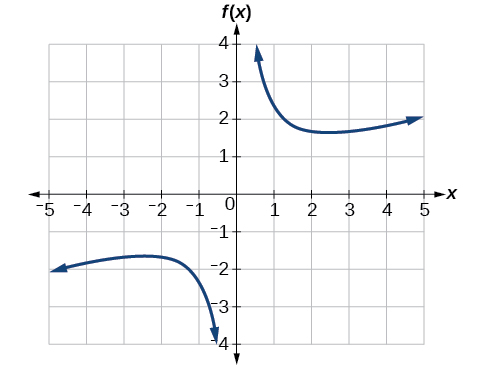
Graph the function f ( x ) = 2 x + x 3 . Then use the graph to estimate the local extrema of the function and to determine the intervals on which the function is increasing.

Using technology, we find that the graph of the function looks like that in [link] . It appears there is a low point, or local minimum, between x = 2 and x = 3 , and a mirror-image high point, or local maximum, somewhere between x = −3 and x = −2.

Graph of a reciprocal function.
Got questions? Get instant answers now!

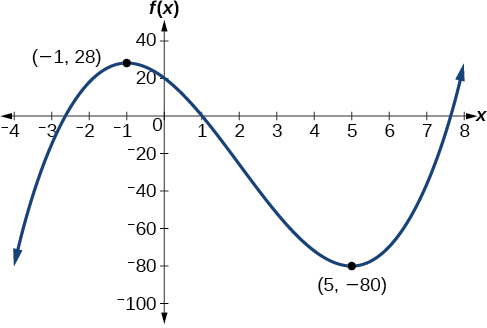
Graph the function f ( x ) = x 3 6 x 2 15 x + 20 to estimate the local extrema of the function. Use these to determine the intervals on which the function is increasing and decreasing.

The local maximum appears to occur at ( 1 , 28 ) , and the local minimum occurs at ( 5 , 80 ) . The function is increasing on ( , 1 ) ( 5 , ) and decreasing on ( 1 , 5 ) .

Graph of a polynomial with a local maximum at (-1, 28) and local minimum at (5, -80).
Got questions? Get instant answers now!

Finding local maxima and minima from a graph

For the function f whose graph is shown in [link] , find all local maxima and minima.
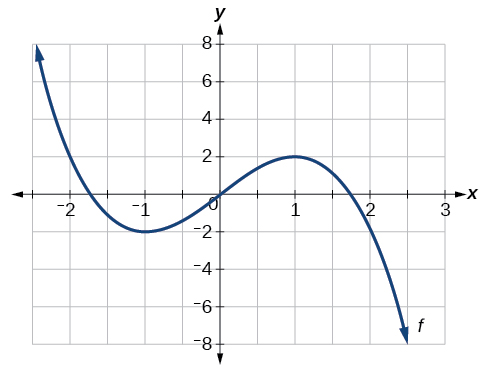
Graph of a polynomial.

Observe the graph of f . The graph attains a local maximum at x = 1 because it is the highest point in an open interval around x = 1. The local maximum is the y -coordinate at x = 1 , which is 2.

The graph attains a local minimum at   x = −1   because it is the lowest point in an open interval around x = −1. The local minimum is the y -coordinate at x = −1 , which is −2.

Got questions? Get instant answers now!

Analyzing the toolkit functions for increasing or decreasing intervals

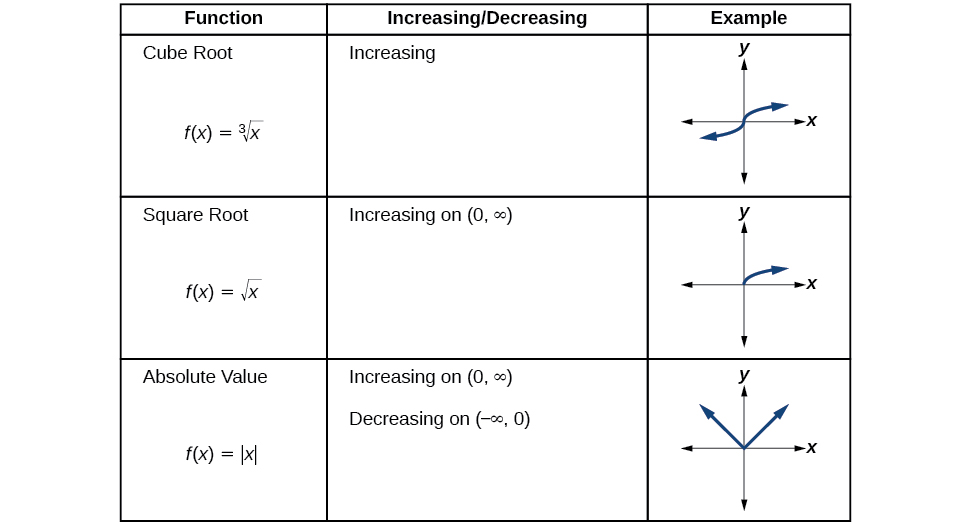
We will now return to our toolkit functions and discuss their graphical behavior in [link] , [link] , and [link] .
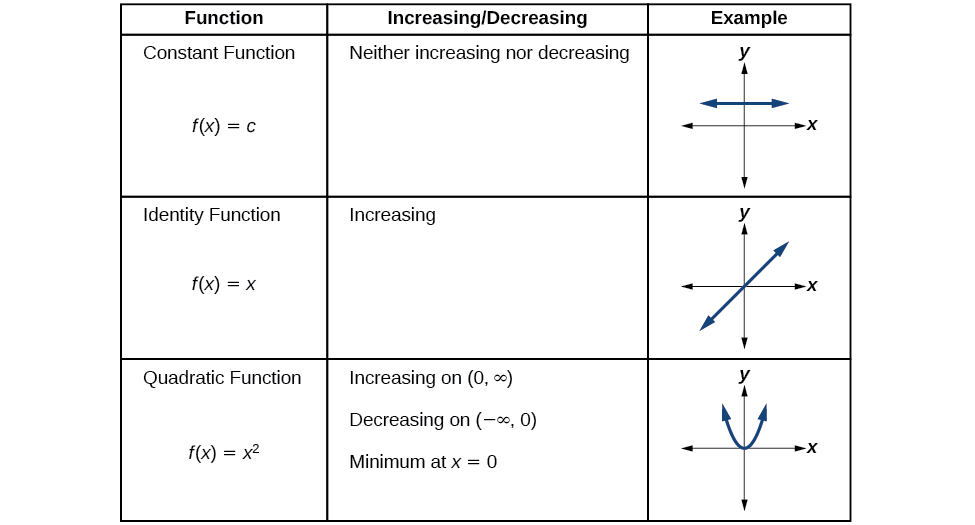
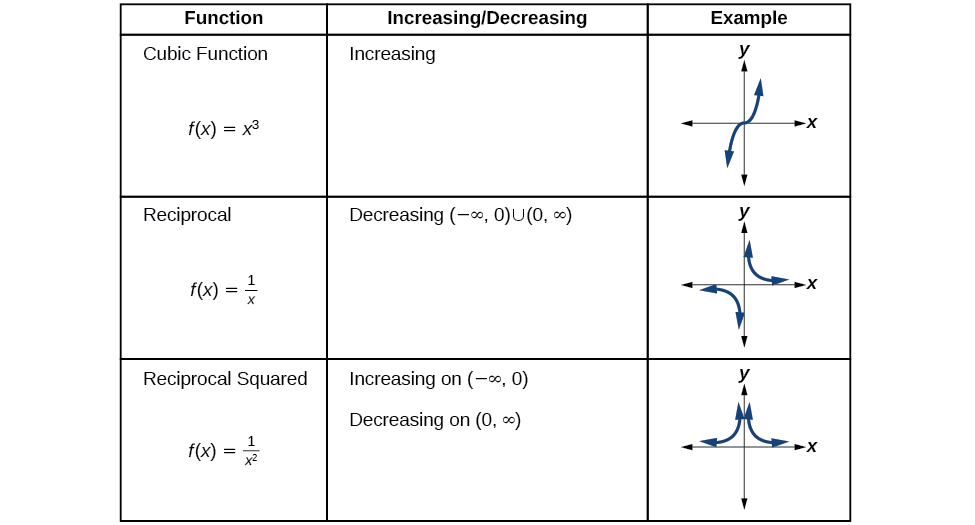
Table showing the increasing and decreasing intervals of the toolkit functions.

Use a graph to locate the absolute maximum and absolute minimum

There is a difference between locating the highest and lowest points on a graph in a region around an open interval (locally) and locating the highest and lowest points on the graph for the entire domain. The y - coordinates (output) at the highest and lowest points are called the absolute maximum and absolute minimum , respectively.

To locate absolute maxima and minima from a graph, we need to observe the graph to determine where the graph attains it highest and lowest points on the domain of the function. See [link] .
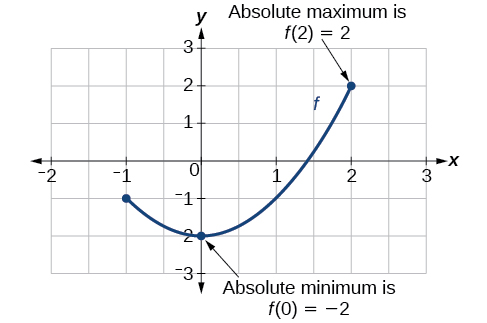
Graph of a segment of a parabola with an absolute minimum at (0, -2) and absolute maximum at (2, 2).

Not every function has an absolute maximum or minimum value. The toolkit function f ( x ) = x 3 is one such function.

Absolute maxima and minima

The absolute maximum    of f at x = c is f ( c ) where f ( c ) f ( x ) for all x in the domain of f .

The absolute minimum    of f at x = d is f ( d ) where f ( d ) f ( x ) for all x in the domain of f .

Finding absolute maxima and minima from a graph

For the function f shown in [link] , find all absolute maxima and minima.
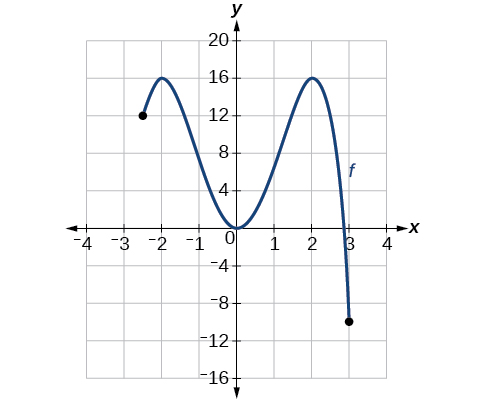
Graph of a polynomial.

Observe the graph of f . The graph attains an absolute maximum in two locations, x = −2 and x = 2 , because at these locations, the graph attains its highest point on the domain of the function. The absolute maximum is the y -coordinate at x = −2 and x = 2 , which is 16.

The graph attains an absolute minimum at x = 3 , because it is the lowest point on the domain of the function’s graph. The absolute minimum is the y -coordinate at x = 3 , which is −10.

Got questions? Get instant answers now!

Questions & Answers

find the equation of the tangent to the curve y=2x³-x²+3x+1 at the points x=1 and x=3
Esther Reply
derivative of logarithms function
Iqra Reply
how to solve this question
sidra
ex 2.1 question no 11
khansa
anyone can help me
khansa
question please
Rasul
ex 2.1 question no. 11
khansa
i cant type here
khansa
Find the derivative of g(x)=−3.
Abdullah Reply
any genius online ? I need help!!
Guzorochi Reply
how can i help you?
Pina
need to learn polynomial
Zakariya
i will teach...
nandu
I'm waiting
Zakariya
plz help me in question
Abish
How can I help you?
Tlou
evaluate the following computation (x³-8/x-2)
Murtala Reply
teach me how to solve the first law of calculus.
Uncle Reply
teach me also how to solve the first law of calculus
Bilson
what is differentiation
Ibrahim Reply
only god knows😂
abdulkadir
f(x) = x-2 g(x) = 3x + 5 fog(x)? f(x)/g(x)
Naufal Reply
fog(x)= f(g(x)) = x-2 = 3x+5-2 = 3x+3 f(x)/g(x)= x-2/3x+5
diron
pweding paturo nsa calculus?
jimmy
how to use fundamental theorem to solve exponential
JULIA Reply
find the bounded area of the parabola y^2=4x and y=16x
Omar Reply
what is absolute value means?
Geo Reply
Chicken nuggets
Hugh
🐔
MM
🐔🦃 nuggets
MM
(mathematics) For a complex number a+bi, the principal square root of the sum of the squares of its real and imaginary parts, √a2+b2 . Denoted by | |. The absolute value |x| of a real number x is √x2 , which is equal to x if x is non-negative, and −x if x is negative.
Ismael
find integration of loge x
Game Reply
find the volume of a solid about the y-axis, x=0, x=1, y=0, y=7+x^3
Godwin Reply
how does this work
Brad Reply
Can calculus give the answers as same as other methods give in basic classes while solving the numericals?
Cosmos Reply
log tan (x/4+x/2)
Rohan
please answer
Rohan
y=(x^2 + 3x).(eipix)
Claudia
is this a answer
Ismael
Got questions? Join the online conversation and get instant answers!
Jobilize.com Reply
Practice Key Terms 9

Get Jobilize Job Search Mobile App in your pocket Now!

Get it on Google Play Download on the App Store Now


Source:  OpenStax, Algebra and trigonometry. OpenStax CNX. Nov 14, 2016 Download for free at https://legacy.cnx.org/content/col11758/1.6
Google Play and the Google Play logo are trademarks of Google Inc.

Notification Switch

Would you like to follow the 'Algebra and trigonometry' conversation and receive update notifications?

Ask