

| << Chapter < Page | Chapter >> Page > |
One study indicates that the number of televisions that American families have is distributed (this is the given distribution for the American population) as in [link] .
| Number of Televisions | Percent |
|---|---|
| 0 | 10 |
| 1 | 16 |
| 2 | 55 |
| 3 | 11 |
| 4+ | 8 |
The table contains expected ( E ) percents.
A random sample of 600 families in the far western United States resulted in the data in [link] .
| Number of Televisions | Frequency |
|---|---|
| Total = 600 | |
| 0 | 66 |
| 1 | 119 |
| 2 | 340 |
| 3 | 60 |
| 4+ | 15 |
The table contains observed ( O ) frequency values.
At the 1% significance level, does it appear that the distribution "number of televisions" of far western United States families is different from the distribution for the American population as a whole?
This problem asks you to test whether the far western United States families distribution fits the distribution of the American families. This test is always right-tailed.
The first table contains expected percentages. To get expected ( E ) frequencies, multiply the percentage by 600. The expected frequencies are shown in [link] .
| Number of Televisions | Percent | Expected Frequency |
|---|---|---|
| 0 | 10 | (0.10)(600) = 60 |
| 1 | 16 | (0.16)(600) = 96 |
| 2 | 55 | (0.55)(600) = 330 |
| 3 | 11 | (0.11)(600) = 66 |
| over 3 | 8 | (0.08)(600) = 48 |
Therefore, the expected frequencies are 60, 96, 330, 66, and 48. In the TI calculators, you can let the calculator do the math. For example, instead of 60, enter 0.10*600.
H 0 : The "number of televisions" distribution of far western United States families is the same as the "number of televisions" distribution of the American population.
H a : The "number of televisions" distribution of far western United States families is different from the "number of televisions" distribution of the American population.
Distribution for the test: where df = (the number of cells) – 1 = 5 – 1 = 4.
df ≠ 600 – 1
Calculate the test statistic: χ 2 = 29.65
Graph:
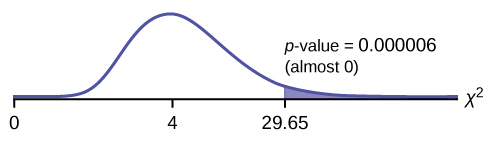
Probability statement: p -value = P ( χ 2 >29.65) = 0.000006
Compare α and the p -value:
Make a decision: Since α > p -value, reject H o .
This means you reject the belief that the distribution for the far western states is the same as that of the American population as a whole.
Conclusion: At the 1% significance level, from the data, there is sufficient evidence to conclude that the "number of televisions" distribution for the far western United States is different from the "number of televisions" distribution for the American population as a whole.
Press
STAT and
ENTER . Make sure to clear lists
L1 ,
L2 , and
L3 if they have data in them (see the note at the end of
[link] ). Into
L1 , put the observed frequencies
66 ,
119 ,
349 ,
60 ,
15 . Into
L2 , put the expected frequencies
.10*600, .16*600 ,
.55*600 ,
.11*600 ,
.08*600 . Arrow over to list
L3 and up to the name area
"L3" . Enter
(L1-L2)^2/L2 and
ENTER . Press
2nd QUIT . Press
2nd LIST and arrow over to
MATH . Press
5 . You should see
"sum" (Enter L3) . Rounded to 2 decimal places, you should see
29.65 . Press
2nd DISTR . Press
7 or Arrow down to
7:χ2cdf and press
ENTER . Enter
(29.65,1E99,4) . Rounded to four places, you should see
5.77E-6 = .000006 (rounded to six decimal places), which is the p-value.
The newer TI-84 calculators have in
STAT TESTS the test
Chi2 GOF . To run the test, put the observed values (the data) into a first list and the expected values (the values you expect if the null hypothesis is true) into a second list. Press
STAT TESTS and
Chi2 GOF . Enter the list names for the Observed list and the Expected list. Enter the degrees of freedom and press
calculate or
draw . Make sure you clear any lists before you start.
Notification Switch
Would you like to follow the 'Introductory statistics' conversation and receive update notifications?

|
|
|
|
|

|
|

|
|

|
|

|
|

|
|

|
|
|
|
|

|
|

|
|
|
|