<< Chapter < Page Chapter >> Page >

Although the weak nuclear force is very short ranged ( <10 18   m , as indicated in [link] ), its effects on atomic levels can be measured given the extreme precision of modern techniques. Since electrons spend some time in the nucleus, their energies are affected, and spectra can even indicate new aspects of the weak force, such as the possibility of other carrier particles. So systems many orders of magnitude larger than the range of the weak force supply evidence of electroweak unification in addition to evidence found at the particle scale.
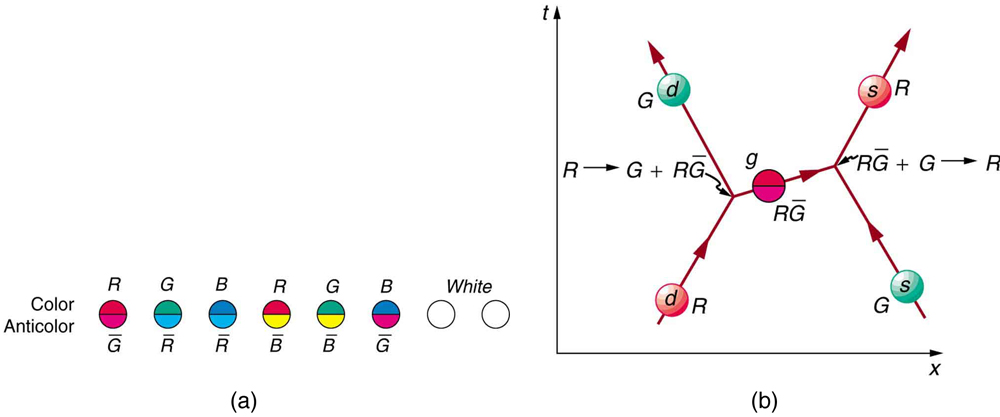
Gluons ( g size 12{g} {} ) are the proposed carrier particles for the strong nuclear force, although they are not directly observed. Like quarks, gluons may be confined to systems having a total color of white. Less is known about gluons than the fact that they are the carriers of the weak and certainly of the electromagnetic force. QCD theory calls for eight gluons, all massless and all spin 1. Six of the gluons carry a color and an anticolor, while two do not carry color, as illustrated in [link] (a). There is indirect evidence of the existence of gluons in nucleons. When high-energy electrons are scattered from nucleons and evidence of quarks is seen, the momenta of the quarks are smaller than they would be if there were no gluons. That means that the gluons carrying force between quarks also carry some momentum, inferred by the already indirect quark momentum measurements. At any rate, the gluons carry color charge and can change the colors of quarks when exchanged, as seen in [link] (b). In the figure, a red down quark interacts with a green strange quark by sending it a gluon. That gluon carries red away from the down quark and leaves it green, because it is an R G - size 12{R { bar {G}}} {} (red-antigreen) gluon. (Taking antigreen away leaves you green.) Its antigreenness kills the green in the strange quark, and its redness turns the quark red.

The first image shows eight circles representing gluons. The first gluon is colored red and anti green, the second gluon is colored green and anti red, the third gluon is colored blue and anti red, the fourth gluon is colored red and anti blue, the fifth gluon is colored green and anti blue, and the sixth gluon is colored blue and anti green. The last two gluons are white. The second image shows a Feynman diagram in which time proceeds in along the vertical y axis and distance along the horizontal x axis. A red down quark and a green strange quark are approaching each other. They exchange a red and anti green gluon, then move apart, with the red down quark having changed to a green down quark and the green strange quark having changed to a red strange quark.
In figure (a), the eight types of gluons that carry the strong nuclear force are divided into a group of six that carry color and a group of two that do not. Figure (b) shows that the exchange of gluons between quarks carries the strong force and may change the color of a quark.

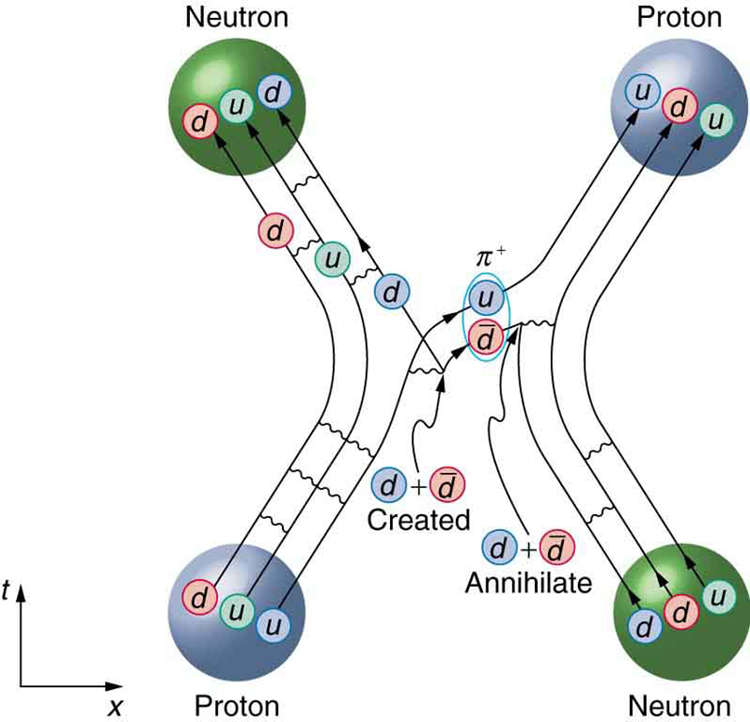
The strong force is complicated, since observable particles that feel the strong force (hadrons) contain multiple quarks. [link] shows the quark and gluon details of pion exchange between a proton and a neutron as illustrated earlier in [link] and [link] . The quarks within the proton and neutron move along together exchanging gluons, until the proton and neutron get close together. As the u size 12{u} {} quark leaves the proton, a gluon creates a pair of virtual particles, a d size 12{d} {} quark and a d - size 12{ { bar {d}}} {} antiquark. The d size 12{d} {} quark stays behind and the proton turns into a neutron, while the u size 12{u} {} and d - size 12{ { bar {d}}} {} move together as a π + size 12{π rSup { size 8{+{}} } } {} ( [link] confirms the u d - size 12{u { bar {d}}} {} composition for the π + size 12{π rSup { size 8{+{}} } } {} .) The d - size 12{ { bar {d}}} {} annihilates a d size 12{d} {} quark in the neutron, the u size 12{u} {} joins the neutron, and the neutron becomes a proton. A pion is exchanged and a force is transmitted.

The Feynman diagram shows a proton scattering from a neutron. In the process , the proton becomes a neutron and the neutron becomes a proton. The details of the interaction are explained in the text.
This Feynman diagram is the same interaction as shown in [link] , but it shows the quark and gluon details of the strong force interaction.

Questions & Answers

differentiate between demand and supply giving examples
Lambiv Reply
differentiated between demand and supply using examples
Lambiv
what is labour ?
Lambiv
how will I do?
Venny Reply
how is the graph works?I don't fully understand
Rezat Reply
information
Eliyee
devaluation
Eliyee
t
WARKISA
hi guys good evening to all
Lambiv
multiple choice question
Aster Reply
appreciation
Eliyee
explain perfect market
Lindiwe Reply
In economics, a perfect market refers to a theoretical construct where all participants have perfect information, goods are homogenous, there are no barriers to entry or exit, and prices are determined solely by supply and demand. It's an idealized model used for analysis,
Ezea
What is ceteris paribus?
Shukri Reply
other things being equal
AI-Robot
When MP₁ becomes negative, TP start to decline. Extuples Suppose that the short-run production function of certain cut-flower firm is given by: Q=4KL-0.6K2 - 0.112 • Where is quantity of cut flower produced, I is labour input and K is fixed capital input (K-5). Determine the average product of lab
Kelo
Extuples Suppose that the short-run production function of certain cut-flower firm is given by: Q=4KL-0.6K2 - 0.112 • Where is quantity of cut flower produced, I is labour input and K is fixed capital input (K-5). Determine the average product of labour (APL) and marginal product of labour (MPL)
Kelo
yes,thank you
Shukri
Can I ask you other question?
Shukri
what is monopoly mean?
Habtamu Reply
What is different between quantity demand and demand?
Shukri Reply
Quantity demanded refers to the specific amount of a good or service that consumers are willing and able to purchase at a give price and within a specific time period. Demand, on the other hand, is a broader concept that encompasses the entire relationship between price and quantity demanded
Ezea
ok
Shukri
how do you save a country economic situation when it's falling apart
Lilia Reply
what is the difference between economic growth and development
Fiker Reply
Economic growth as an increase in the production and consumption of goods and services within an economy.but Economic development as a broader concept that encompasses not only economic growth but also social & human well being.
Shukri
production function means
Jabir
What do you think is more important to focus on when considering inequality ?
Abdisa Reply
any question about economics?
Awais Reply
sir...I just want to ask one question... Define the term contract curve? if you are free please help me to find this answer 🙏
Asui
it is a curve that we get after connecting the pareto optimal combinations of two consumers after their mutually beneficial trade offs
Awais
thank you so much 👍 sir
Asui
In economics, the contract curve refers to the set of points in an Edgeworth box diagram where both parties involved in a trade cannot be made better off without making one of them worse off. It represents the Pareto efficient allocations of goods between two individuals or entities, where neither p
Cornelius
In economics, the contract curve refers to the set of points in an Edgeworth box diagram where both parties involved in a trade cannot be made better off without making one of them worse off. It represents the Pareto efficient allocations of goods between two individuals or entities,
Cornelius
Suppose a consumer consuming two commodities X and Y has The following utility function u=X0.4 Y0.6. If the price of the X and Y are 2 and 3 respectively and income Constraint is birr 50. A,Calculate quantities of x and y which maximize utility. B,Calculate value of Lagrange multiplier. C,Calculate quantities of X and Y consumed with a given price. D,alculate optimum level of output .
Feyisa Reply
Answer
Feyisa
c
Jabir
the market for lemon has 10 potential consumers, each having an individual demand curve p=101-10Qi, where p is price in dollar's per cup and Qi is the number of cups demanded per week by the i th consumer.Find the market demand curve using algebra. Draw an individual demand curve and the market dema
Gsbwnw Reply
suppose the production function is given by ( L, K)=L¼K¾.assuming capital is fixed find APL and MPL. consider the following short run production function:Q=6L²-0.4L³ a) find the value of L that maximizes output b)find the value of L that maximizes marginal product
Abdureman
types of unemployment
Yomi Reply
What is the difference between perfect competition and monopolistic competition?
Mohammed
Got questions? Join the online conversation and get instant answers!
Jobilize.com Reply
Practice Key Terms 7

Get Jobilize Job Search Mobile App in your pocket Now!

Get it on Google Play Download on the App Store Now


Source:  OpenStax, College physics. OpenStax CNX. Jul 27, 2015 Download for free at http://legacy.cnx.org/content/col11406/1.9
Google Play and the Google Play logo are trademarks of Google Inc.

Notification Switch

Would you like to follow the 'College physics' conversation and receive update notifications?

Ask