

| << Chapter < Page | Chapter >> Page > |
pH = −log(0.100) = 1.000
(b) X = 12.50 mL
pH = −log(0.0333) = 1.477
(c) X = 25.00 mL
Since the volumes and concentrations of the acid and base solutions are the same: and pH = 7.000, as described earlier.
(d) X = 37.50 mL
In this case:
pH = 14 − pOH = 14 + log([OH − ]) = 14 + log(0.0200) = 12.30
0.00: 1.000; 15.0: 1.5111; 25.0: 7; 40.0: 12.523
In the example, we calculated pH at four points during a titration. [link] shows a detailed sequence of changes in the pH of a strong acid and a weak acid in a titration with NaOH.
| pH Values in the Titrations of a Strong Acid with a Strong Base and of a Weak Acid with a Strong Base | |||
|---|---|---|---|
| Volume of 0.100 M NaOH Added (mL) | Moles of NaOH Added | pH Values 0.100 M HCl Titration of 25.00 mL of 0.100 M HCl (0.00250 mol of HCI) with 0.100 M NaOH. | pH Values 0.100 M CH 3 CO 2 H Titration of 25.00 mL of 0.100 M CH 3 CO 2 H (0.00250 mol of CH 3 CO 2 H) with 0.100 M NaOH. |
| 0.0 | 0.0 | 1.00 | 2.87 |
| 5.0 | 0.00050 | 1.18 | 4.14 |
| 10.0 | 0.00100 | 1.37 | 4.57 |
| 15.0 | 0.00150 | 1.60 | 4.92 |
| 20.0 | 0.00200 | 1.95 | 5.35 |
| 22.0 | 0.00220 | 2.20 | 5.61 |
| 24.0 | 0.00240 | 2.69 | 6.13 |
| 24.5 | 0.00245 | 3.00 | 6.44 |
| 24.9 | 0.00249 | 3.70 | 7.14 |
| 25.0 | 0.00250 | 7.00 | 8.72 |
| 25.1 | 0.00251 | 10.30 | 10.30 |
| 25.5 | 0.00255 | 11.00 | 11.00 |
| 26.0 | 0.00260 | 11.29 | 11.29 |
| 28.0 | 0.00280 | 11.75 | 11.75 |
| 30.0 | 0.00300 | 11.96 | 11.96 |
| 35.0 | 0.00350 | 12.22 | 12.22 |
| 40.0 | 0.00400 | 12.36 | 12.36 |
| 45.0 | 0.00450 | 12.46 | 12.46 |
| 50.0 | 0.00500 | 12.52 | 12.52 |
The simplest acid-base reactions are those of a strong acid with a strong base. [link] shows data for the titration of a 25.0-mL sample of 0.100 M hydrochloric acid with 0.100 M sodium hydroxide. The values of the pH measured after successive additions of small amounts of NaOH are listed in the first column of this table, and are graphed in [link] , in a form that is called a titration curve . The pH increases slowly at first, increases rapidly in the middle portion of the curve, and then increases slowly again. The point of inflection (located at the midpoint of the vertical part of the curve) is the equivalence point for the titration. It indicates when equivalent quantities of acid and base are present. For the titration of a strong acid with a strong base, the equivalence point occurs at a pH of 7.00 and the points on the titration curve can be calculated using solution stoichiometry ( [link] and [link] ).
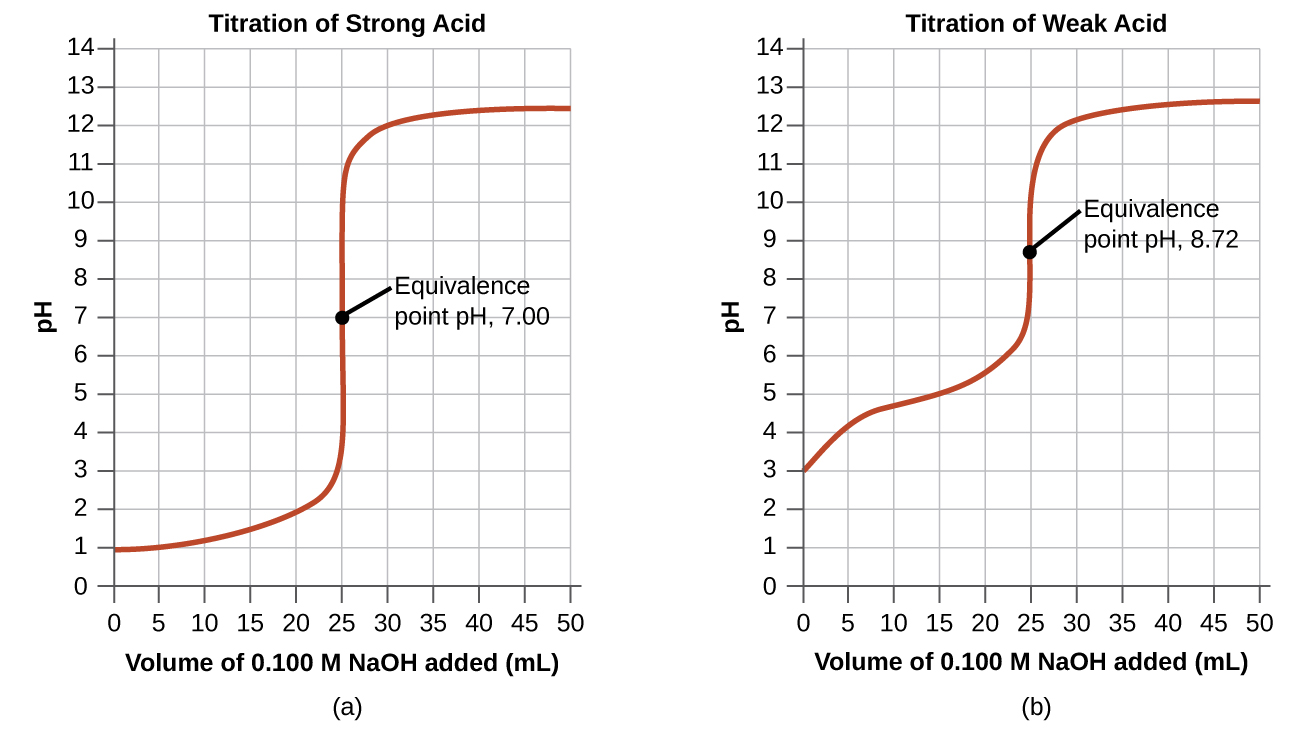
The titration of a weak acid with a strong base (or of a weak base with a strong acid) is somewhat more complicated than that just discussed, but it follows the same general principles. Let us consider the titration of 25.0 mL of 0.100 M acetic acid (a weak acid) with 0.100 M sodium hydroxide and compare the titration curve with that of the strong acid. [link] gives the pH values during the titration, [link] shows the titration curve.
Notification Switch
Would you like to follow the 'Chemistry' conversation and receive update notifications?

|
|
|
|
|

|
|

|
|

|
|

|
|

|
|

|
|

|
|

|
|

|
|
|
|