<< Chapter < Page Chapter >> Page >

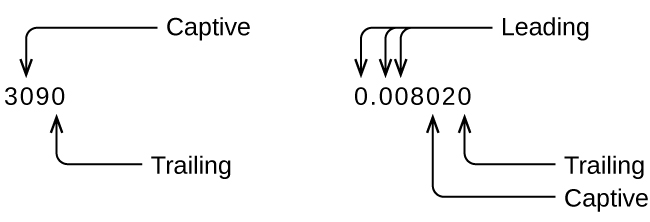
Whenever you make a measurement properly, all the digits in the result are significant. But what if you were analyzing a reported value and trying to determine what is significant and what is not? Well, for starters, all nonzero digits are significant, and it is only zeros that require some thought. We will use the terms “leading,” “trailing,” and “captive” for the zeros and will consider how to deal with them.

The left diagram uses the example of 3090. The zero in the hundreds place is labeled “captive” and the zero in the ones place is labeled trailing. The right diagram uses the example 0.008020. The three zeros in the ones, tenths, and hundredths places are labeled “leading.” The zero in the ten-thousandths place is labeled “captive” and the zero in the millionths place is labeled “trailing.”

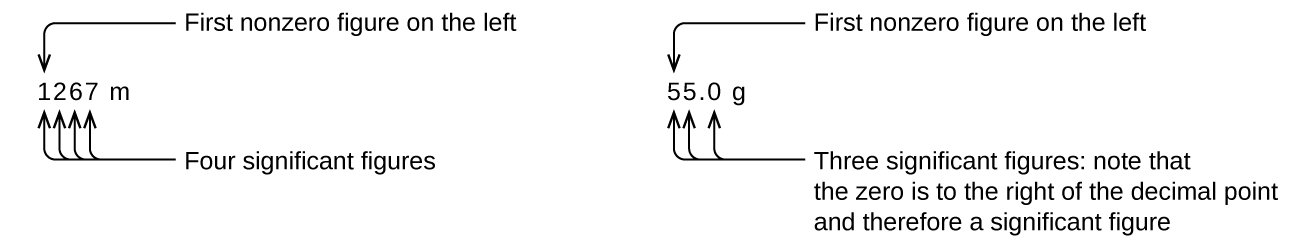
Starting with the first nonzero digit on the left, count this digit and all remaining digits to the right. This is the number of significant figures in the measurement unless the last digit is a trailing zero lying to the left of the decimal point.

The left diagram uses the example of 1267 meters. The number 1 is the first nonzero figure on the left. 1267 has 4 significant figures in total. The right diagram uses the example of 55.0 grams. The number 5 in the tens place is the first nonzero figure on the left. 55.0 has 3 significant figures. Note that the 0 is to the right of the decimal point and therefore is a significant figure.

Captive zeros result from measurement and are therefore always significant. Leading zeros, however, are never significant—they merely tell us where the decimal point is located.

The left diagram uses the example of 70.607 milliliters. The number 7 is the first nonzero figure on the left. 70.607 has 5 significant figures in total, as all figures are measured including the 2 zeros. The right diagram uses the example of 0.00832407 M L. The number 8 is the first nonzero figure on the left. 0.00832407 has 6 significant figures.

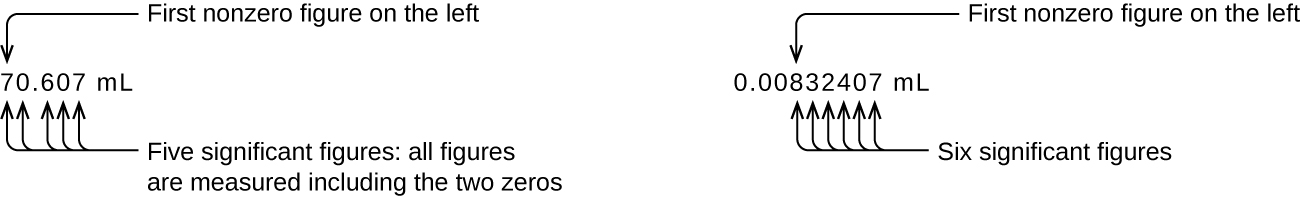
The leading zeros in this example are not significant. We could use exponential notation (as described in Appendix B) and express the number as 8.32407 × 10 −3 ; then the number 8.32407 contains all of the significant figures, and 10 −3 locates the decimal point.

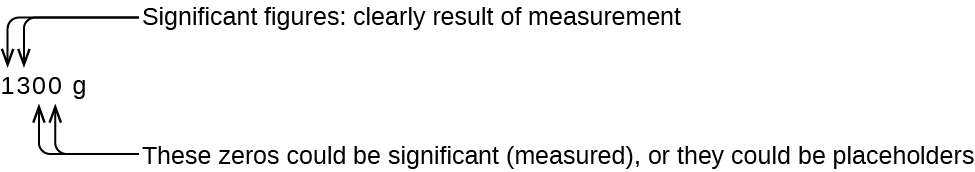
The number of significant figures is uncertain in a number that ends with a zero to the left of the decimal point location. The zeros in the measurement 1,300 grams could be significant or they could simply indicate where the decimal point is located. The ambiguity can be resolved with the use of exponential notation: 1.3 × 10 3 (two significant figures), 1.30 × 10 3 (three significant figures, if the tens place was measured), or 1.300 × 10 3 (four significant figures, if the ones place was also measured). In cases where only the decimal-formatted number is available, it is prudent to assume that all trailing zeros are not significant.

This figure uses the example of 1300 grams. The one and the 3 are significant figures as they are clearly the result of measurement. The 2 zeros could be significant if they were measured or they could be placeholders.

When determining significant figures, be sure to pay attention to reported values and think about the measurement and significant figures in terms of what is reasonable or likely when evaluating whether the value makes sense. For example, the official January 2014 census reported the resident population of the US as 317,297,725. Do you think the US population was correctly determined to the reported nine significant figures, that is, to the exact number of people? People are constantly being born, dying, or moving into or out of the country, and assumptions are made to account for the large number of people who are not actually counted. Because of these uncertainties, it might be more reasonable to expect that we know the population to within perhaps a million or so, in which case the population should be reported as 3.17 × 10 8 people.

Significant figures in calculations

A second important principle of uncertainty is that results calculated from a measurement are at least as uncertain as the measurement itself. We must take the uncertainty in our measurements into account to avoid misrepresenting the uncertainty in calculated results. One way to do this is to report the result of a calculation with the correct number of significant figures, which is determined by the following three rules for rounding    numbers:

Questions & Answers

differentiate between demand and supply giving examples
Lambiv Reply
differentiated between demand and supply using examples
Lambiv
what is labour ?
Lambiv
how will I do?
Venny Reply
how is the graph works?I don't fully understand
Rezat Reply
information
Eliyee
devaluation
Eliyee
t
WARKISA
hi guys good evening to all
Lambiv
multiple choice question
Aster Reply
appreciation
Eliyee
explain perfect market
Lindiwe Reply
In economics, a perfect market refers to a theoretical construct where all participants have perfect information, goods are homogenous, there are no barriers to entry or exit, and prices are determined solely by supply and demand. It's an idealized model used for analysis,
Ezea
What is ceteris paribus?
Shukri Reply
other things being equal
AI-Robot
When MP₁ becomes negative, TP start to decline. Extuples Suppose that the short-run production function of certain cut-flower firm is given by: Q=4KL-0.6K2 - 0.112 • Where is quantity of cut flower produced, I is labour input and K is fixed capital input (K-5). Determine the average product of lab
Kelo
Extuples Suppose that the short-run production function of certain cut-flower firm is given by: Q=4KL-0.6K2 - 0.112 • Where is quantity of cut flower produced, I is labour input and K is fixed capital input (K-5). Determine the average product of labour (APL) and marginal product of labour (MPL)
Kelo
yes,thank you
Shukri
Can I ask you other question?
Shukri
what is monopoly mean?
Habtamu Reply
What is different between quantity demand and demand?
Shukri Reply
Quantity demanded refers to the specific amount of a good or service that consumers are willing and able to purchase at a give price and within a specific time period. Demand, on the other hand, is a broader concept that encompasses the entire relationship between price and quantity demanded
Ezea
ok
Shukri
how do you save a country economic situation when it's falling apart
Lilia Reply
what is the difference between economic growth and development
Fiker Reply
Economic growth as an increase in the production and consumption of goods and services within an economy.but Economic development as a broader concept that encompasses not only economic growth but also social & human well being.
Shukri
production function means
Jabir
What do you think is more important to focus on when considering inequality ?
Abdisa Reply
any question about economics?
Awais Reply
sir...I just want to ask one question... Define the term contract curve? if you are free please help me to find this answer 🙏
Asui
it is a curve that we get after connecting the pareto optimal combinations of two consumers after their mutually beneficial trade offs
Awais
thank you so much 👍 sir
Asui
In economics, the contract curve refers to the set of points in an Edgeworth box diagram where both parties involved in a trade cannot be made better off without making one of them worse off. It represents the Pareto efficient allocations of goods between two individuals or entities, where neither p
Cornelius
In economics, the contract curve refers to the set of points in an Edgeworth box diagram where both parties involved in a trade cannot be made better off without making one of them worse off. It represents the Pareto efficient allocations of goods between two individuals or entities,
Cornelius
Suppose a consumer consuming two commodities X and Y has The following utility function u=X0.4 Y0.6. If the price of the X and Y are 2 and 3 respectively and income Constraint is birr 50. A,Calculate quantities of x and y which maximize utility. B,Calculate value of Lagrange multiplier. C,Calculate quantities of X and Y consumed with a given price. D,alculate optimum level of output .
Feyisa Reply
Answer
Feyisa
c
Jabir
the market for lemon has 10 potential consumers, each having an individual demand curve p=101-10Qi, where p is price in dollar's per cup and Qi is the number of cups demanded per week by the i th consumer.Find the market demand curve using algebra. Draw an individual demand curve and the market dema
Gsbwnw Reply
suppose the production function is given by ( L, K)=L¼K¾.assuming capital is fixed find APL and MPL. consider the following short run production function:Q=6L²-0.4L³ a) find the value of L that maximizes output b)find the value of L that maximizes marginal product
Abdureman
types of unemployment
Yomi Reply
What is the difference between perfect competition and monopolistic competition?
Mohammed
Got questions? Join the online conversation and get instant answers!
Jobilize.com Reply
Practice Key Terms 6

Get Jobilize Job Search Mobile App in your pocket Now!

Get it on Google Play Download on the App Store Now


Source:  OpenStax, Chemistry. OpenStax CNX. May 20, 2015 Download for free at http://legacy.cnx.org/content/col11760/1.9
Google Play and the Google Play logo are trademarks of Google Inc.

Notification Switch

Would you like to follow the 'Chemistry' conversation and receive update notifications?

Ask