<< Chapter < Page Chapter >> Page >

Genetic maps

Janssen did not have the technology to demonstrate crossing over so it remained an abstract idea that was not widely accepted. Scientists thought chiasmata were a variation on synapsis and could not understand how chromosomes could break and rejoin. Yet, the data were clear that linkage did not always occur. Ultimately, it took a young undergraduate student and an “all-nighter” to mathematically elucidate the problem of linkage and recombination.

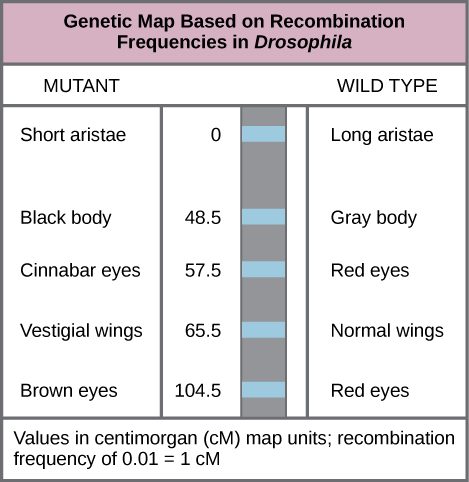
In 1913, Alfred Sturtevant, a student in Morgan’s laboratory, gathered results from researchers in the laboratory, and took them home one night to mull them over. By the next morning, he had created the first “chromosome map,” a linear representation of gene order and relative distance on a chromosome ( [link] ).

Art connection

The illustration shows a Drosophila genetic map. The gene for aristae length occurs at 0 centimorgans, or cM. The gene for body color occurs at 48.5 cM. The gene for red versus cinnabar eye color occurs at 57.5 cM. The gene for wing length occurs at 65.5 cM, and the gene for red versus brown eye color occurs at 104.5 cM. One cM is equivalent to a recombination frequency of 0.01.
This genetic map orders Drosophila genes on the basis of recombination frequency.

Which of the following statements is true?

  1. Recombination of the body color and red/cinnabar eye alleles will occur more frequently than recombination of the alleles for wing length and aristae length.
  2. Recombination of the body color and aristae length alleles will occur more frequently than recombination of red/brown eye alleles and the aristae length alleles.
  3. Recombination of the gray/black body color and long/short aristae alleles will not occur.
  4. Recombination of the red/brown eye and long/short aristae alleles will occur more frequently than recombination of the alleles for wing length and body color.

As shown in [link] , by using recombination frequency to predict genetic distance, the relative order of genes on chromosome 2 could be inferred. The values shown represent map distances in centimorgans (cM), which correspond to recombination frequencies (in percent). Therefore, the genes for body color and wing size were 65.5 − 48.5 = 17 cM apart, indicating that the maternal and paternal alleles for these genes recombine in 17 percent of offspring, on average.

To construct a chromosome map, Sturtevant assumed that genes were ordered serially on threadlike chromosomes. He also assumed that the incidence of recombination between two homologous chromosomes could occur with equal likelihood anywhere along the length of the chromosome. Operating under these assumptions, Sturtevant postulated that alleles that were far apart on a chromosome were more likely to dissociate during meiosis simply because there was a larger region over which recombination could occur. Conversely, alleles that were close to each other on the chromosome were likely to be inherited together. The average number of crossovers between two alleles—that is, their recombination frequency    —correlated with their genetic distance from each other, relative to the locations of other genes on that chromosome. Considering the example cross between AaBb and aabb above, the frequency of recombination could be calculated as 50/1000 = 0.05. That is, the likelihood of a crossover between genes A/a and B/b was 0.05, or 5 percent. Such a result would indicate that the genes were definitively linked, but that they were far enough apart for crossovers to occasionally occur. Sturtevant divided his genetic map into map units, or centimorgans (cM) , in which a recombination frequency of 0.01 corresponds to 1 cM.

Questions & Answers

how do you get the 2/50
Abba Reply
number of sport play by 50 student construct discrete data
Aminu Reply
width of the frangebany leaves on how to write a introduction
Theresa Reply
Solve the mean of variance
Veronica Reply
Step 1: Find the mean. To find the mean, add up all the scores, then divide them by the number of scores. ... Step 2: Find each score's deviation from the mean. ... Step 3: Square each deviation from the mean. ... Step 4: Find the sum of squares. ... Step 5: Divide the sum of squares by n – 1 or N.
kenneth
what is error
Yakuba Reply
Is mistake done to something
Vutshila
Hy
anas
hy
What is the life teble
anas
hy
Jibrin
statistics is the analyzing of data
Tajudeen Reply
what is statics?
Zelalem Reply
how do you calculate mean
Gloria Reply
diveving the sum if all values
Shaynaynay
let A1,A2 and A3 events be independent,show that (A1)^c, (A2)^c and (A3)^c are independent?
Fisaye Reply
what is statistics
Akhisani Reply
data collected all over the world
Shaynaynay
construct a less than and more than table
Imad Reply
The sample of 16 students is taken. The average age in the sample was 22 years with astandard deviation of 6 years. Construct a 95% confidence interval for the age of the population.
Aschalew Reply
Bhartdarshan' is an internet-based travel agency wherein customer can see videos of the cities they plant to visit. The number of hits daily is a normally distributed random variable with a mean of 10,000 and a standard deviation of 2,400 a. what is the probability of getting more than 12,000 hits? b. what is the probability of getting fewer than 9,000 hits?
Akshay Reply
Bhartdarshan'is an internet-based travel agency wherein customer can see videos of the cities they plan to visit. The number of hits daily is a normally distributed random variable with a mean of 10,000 and a standard deviation of 2,400. a. What is the probability of getting more than 12,000 hits
Akshay
1
Bright
Sorry i want to learn more about this question
Bright
Someone help
Bright
a= 0.20233 b=0.3384
Sufiyan
a
Shaynaynay
How do I interpret level of significance?
Mohd Reply
It depends on your business problem or in Machine Learning you could use ROC- AUC cruve to decide the threshold value
Shivam
how skewness and kurtosis are used in statistics
Owen Reply
yes what is it
Taneeya
Got questions? Join the online conversation and get instant answers!
Jobilize.com Reply

Get Jobilize Job Search Mobile App in your pocket Now!

Get it on Google Play Download on the App Store Now


Source:  OpenStax, Biology. OpenStax CNX. Feb 29, 2016 Download for free at http://cnx.org/content/col11448/1.10
Google Play and the Google Play logo are trademarks of Google Inc.

Notification Switch

Would you like to follow the 'Biology' conversation and receive update notifications?

Ask