<< Chapter < Page Chapter >> Page >

Using a regression line to make predictions

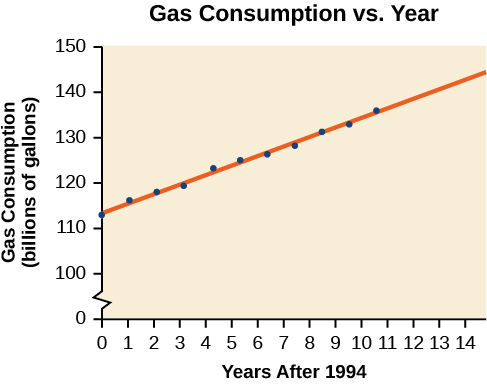
Gasoline consumption in the United States has been steadily increasing. Consumption data from 1994 to 2004 is shown in [link] . http://www.bts.gov/publications/national_transportation_statistics/2005/html/table_04_10.html Determine whether the trend is linear, and if so, find a model for the data. Use the model to predict the consumption in 2008.

Year '94 '95 '96 '97 '98 '99 '00 '01 '02 '03 '04
Consumption (billions of gallons) 113 116 118 119 123 125 126 128 131 133 136

The scatter plot of the data, including the least squares regression line, is shown in [link] .

Scatter plot, showing the line of best fit. It is titled 'Gas Consumption VS Year'. The x-axis is 'Year After 1994', and the y-axis is 'Gas Consumption (billions of gallons)'. The points are strongly positively correlated and the line of best fit goes through most of the points completely.

We can introduce new input variable, t , representing years since 1994.

The least squares regression equation is:

C ( t ) = 113.318 + 2.209 t

Using technology, the correlation coefficient was calculated to be 0.9965, suggesting a very strong increasing linear trend.

Using this to predict consumption in 2008 ( t = 14 ) ,

C ( 14 ) = 113.318 + 2.209 ( 14 )           = 144.244

The model predicts 144.244 billion gallons of gasoline consumption in 2008.

Got questions? Get instant answers now!

Use the model we created using technology in [link] to predict the gas consumption in 2011. Is this an interpolation or an extrapolation?

150.871 billion gallons; extrapolation

Got questions? Get instant answers now!

Access these online resources for additional instruction and practice with fitting linear models to data.

Key concepts

  • Scatter plots show the relationship between two sets of data. See [link] .
  • Scatter plots may represent linear or non-linear models.
  • The line of best fit may be estimated or calculated, using a calculator or statistical software. See [link] .
  • Interpolation can be used to predict values inside the domain and range of the data, whereas extrapolation can be used to predict values outside the domain and range of the data. See [link] .
  • The correlation coefficient, r , indicates the degree of linear relationship between data. See [link] .
  • A regression line best fits the data. See [link] .
  • The least squares regression line is found by minimizing the squares of the distances of points from a line passing through the data and may be used to make predictions regarding either of the variables. See [link] .

Section exercises

Verbal

Describe what it means if there is a model breakdown when using a linear model.

When our model no longer applies, after some value in the domain, the model itself doesn’t hold.

Got questions? Get instant answers now!

What is interpolation when using a linear model?

Got questions? Get instant answers now!

What is extrapolation when using a linear model?

We predict a value outside the domain and range of the data.

Got questions? Get instant answers now!

Explain the difference between a positive and a negative correlation coefficient.

Got questions? Get instant answers now!

Explain how to interpret the absolute value of a correlation coefficient.

The closer the number is to 1, the less scattered the data, the closer the number is to 0, the more scattered the data.

Got questions? Get instant answers now!

Algebraic

A regression was run to determine whether there is a relationship between hours of TV watched per day ( x ) and number of sit-ups a person can do ( y ) . The results of the regression are given below. Use this to predict the number of sit-ups a person who watches 11 hours of TV can do.

y = a x + b a = −1.341 b = 32.234   r = −0.896
Got questions? Get instant answers now!

Questions & Answers

Ayele, K., 2003. Introductory Economics, 3rd ed., Addis Ababa.
Widad Reply
can you send the book attached ?
Ariel
?
Ariel
What is economics
Widad Reply
the study of how humans make choices under conditions of scarcity
AI-Robot
U(x,y) = (x×y)1/2 find mu of x for y
Desalegn Reply
U(x,y) = (x×y)1/2 find mu of x for y
Desalegn
what is ecnomics
Jan Reply
this is the study of how the society manages it's scarce resources
Belonwu
what is macroeconomic
John Reply
macroeconomic is the branch of economics which studies actions, scale, activities and behaviour of the aggregate economy as a whole.
husaini
etc
husaini
difference between firm and industry
husaini Reply
what's the difference between a firm and an industry
Abdul
firm is the unit which transform inputs to output where as industry contain combination of firms with similar production 😅😅
Abdulraufu
Suppose the demand function that a firm faces shifted from Qd  120 3P to Qd  90  3P and the supply function has shifted from QS  20  2P to QS 10  2P . a) Find the effect of this change on price and quantity. b) Which of the changes in demand and supply is higher?
Toofiq Reply
explain standard reason why economic is a science
innocent Reply
factors influencing supply
Petrus Reply
what is economic.
Milan Reply
scares means__________________ends resources. unlimited
Jan
economics is a science that studies human behaviour as a relationship b/w ends and scares means which have alternative uses
Jan
calculate the profit maximizing for demand and supply
Zarshad Reply
Why qualify 28 supplies
Milan
what are explicit costs
Nomsa Reply
out-of-pocket costs for a firm, for example, payments for wages and salaries, rent, or materials
AI-Robot
concepts of supply in microeconomics
David Reply
economic overview notes
Amahle Reply
identify a demand and a supply curve
Salome Reply
i don't know
Parul
there's a difference
Aryan
Demand curve shows that how supply and others conditions affect on demand of a particular thing and what percent demand increase whith increase of supply of goods
Israr
Hi Sir please how do u calculate Cross elastic demand and income elastic demand?
Abari
Got questions? Join the online conversation and get instant answers!
Jobilize.com Reply
Practice Key Terms 5

Get Jobilize Job Search Mobile App in your pocket Now!

Get it on Google Play Download on the App Store Now


Source:  OpenStax, College algebra. OpenStax CNX. Feb 06, 2015 Download for free at https://legacy.cnx.org/content/col11759/1.3
Google Play and the Google Play logo are trademarks of Google Inc.

Notification Switch

Would you like to follow the 'College algebra' conversation and receive update notifications?

Ask